Free Access
Fig. C.2
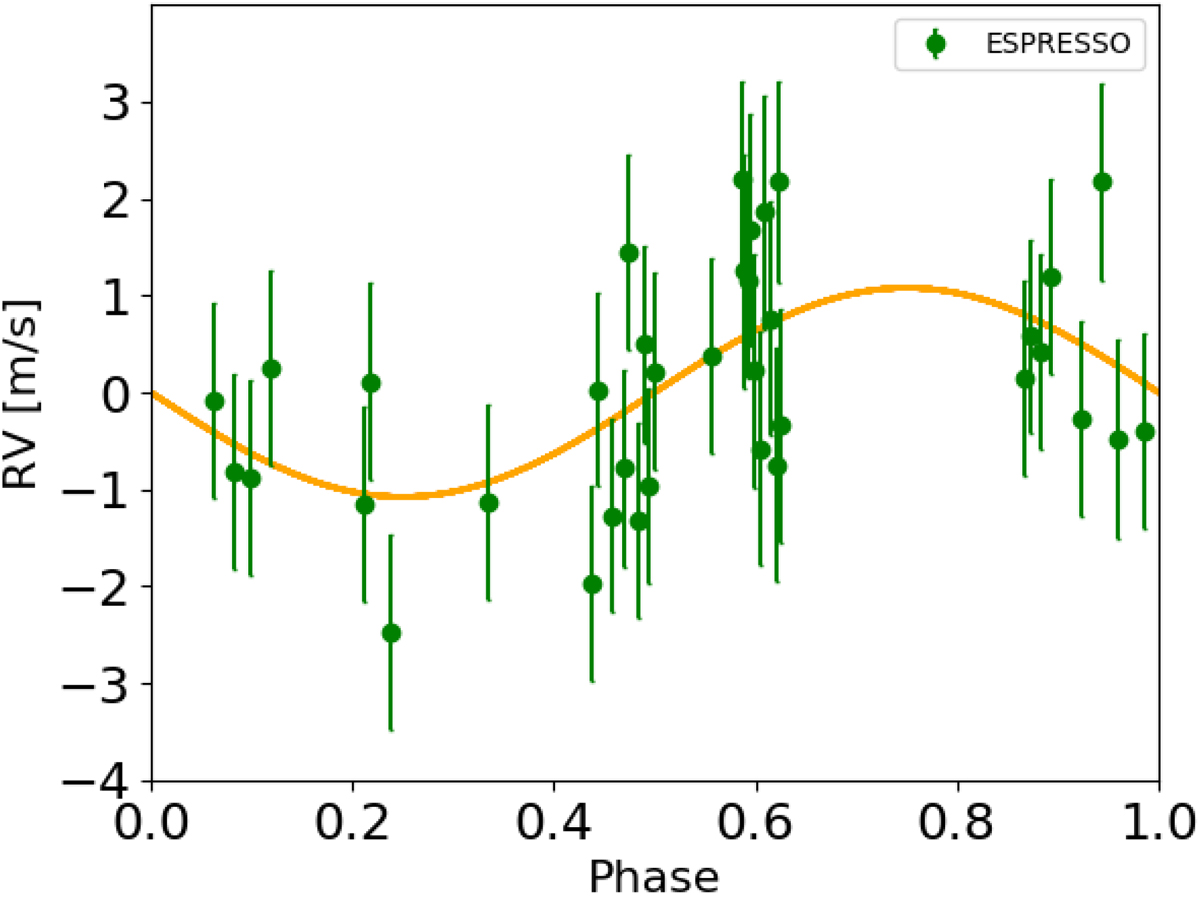
Best-fit model (orange curve) for the additional ~190-d signal found in the RV residuals of ESPRESSO, as derived with a Monte Carlo analysis. The error bars include a constant jitter term added in quadrature to the formal RV uncertainties.
Current usage metrics show cumulative count of Article Views (full-text article views including HTML views, PDF and ePub downloads, according to the available data) and Abstracts Views on Vision4Press platform.
Data correspond to usage on the plateform after 2015. The current usage metrics is available 48-96 hours after online publication and is updated daily on week days.
Initial download of the metrics may take a while.