Fig. A.1
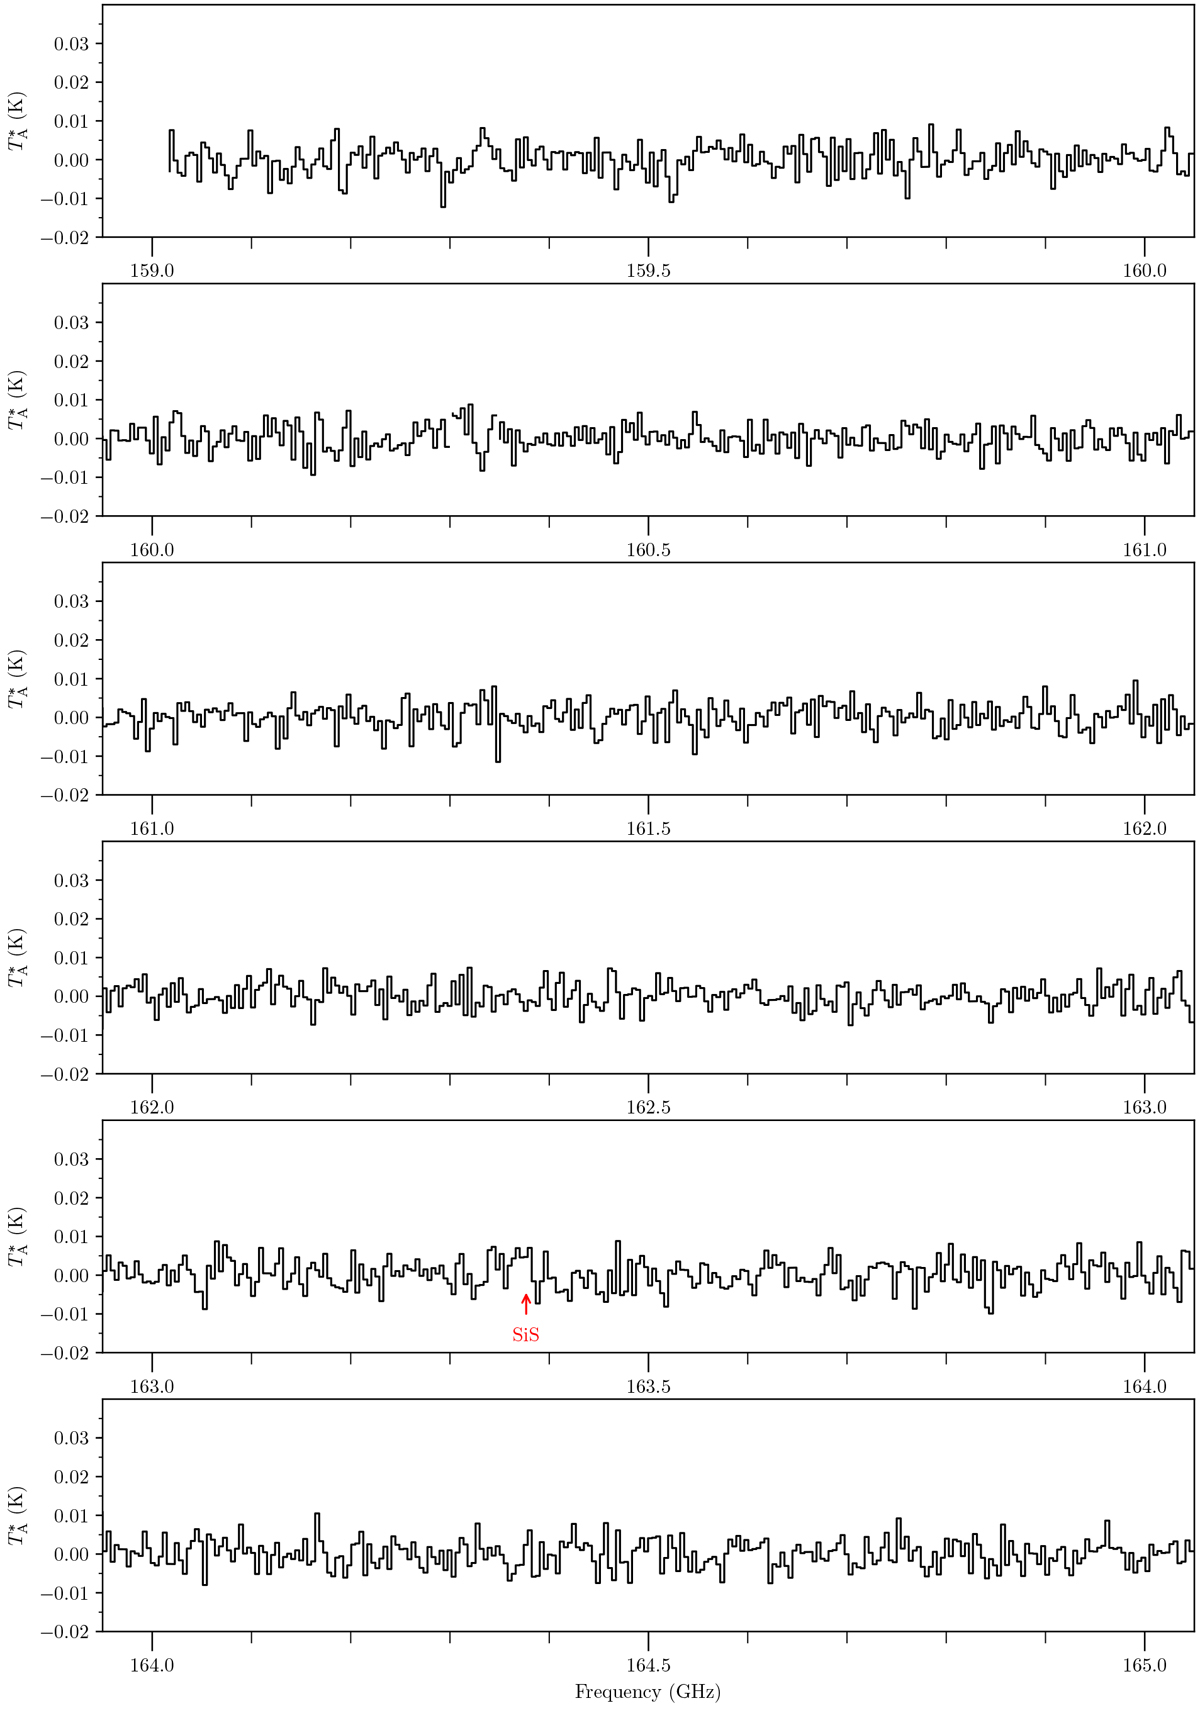
APEX SEPIA/B5 line survey of W Aql. Labels show the carrier molecule of the indicated emission. Red labels indicate tentative or unidentified detections. Purple labels (Im(...)) pertain to emission contaminating the signal from the image sideband (see Sect. 2). For visibility, some parts of the survey were rescaled to fit the vertical scale. The colour coding of the spectrum corresponds to the following scale factors: (black) 1; (green) 1/5. We note that the labellingat frequencies above 209.0 GHz is based on identifications in the PI230 spectrum and is shown here only for reference.
Current usage metrics show cumulative count of Article Views (full-text article views including HTML views, PDF and ePub downloads, according to the available data) and Abstracts Views on Vision4Press platform.
Data correspond to usage on the plateform after 2015. The current usage metrics is available 48-96 hours after online publication and is updated daily on week days.
Initial download of the metrics may take a while.