Fig. 7
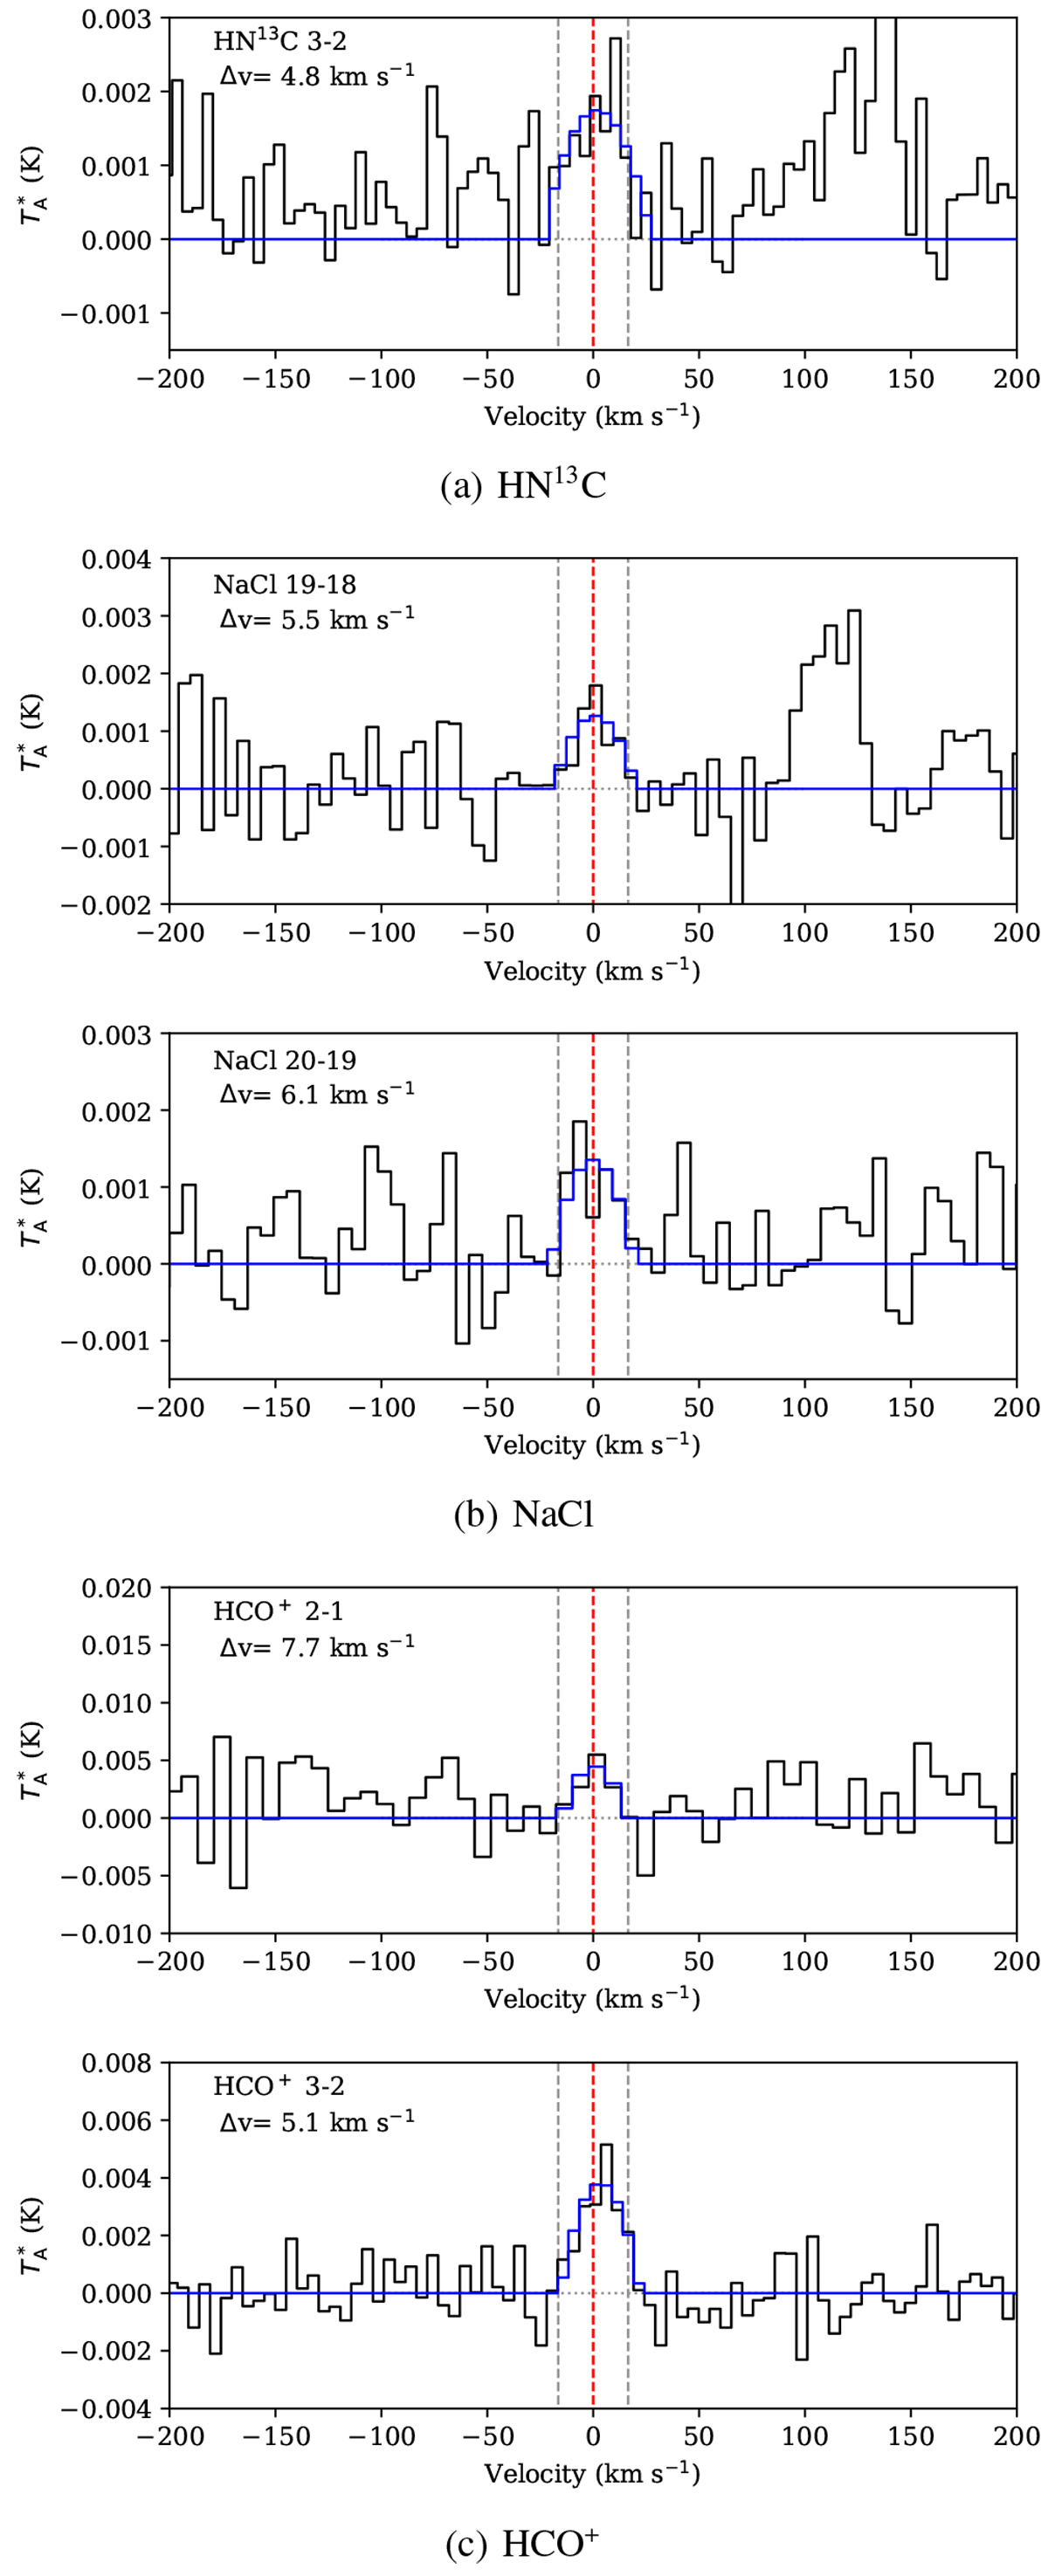
Tentative detections. Red vertical lines correspond to the rest frequencies of the transitions; grey vertical lines indicate the 16.5 km s−1 expansion velocity of the CSE of W Aql; blue fits were produced using the “shell” profile function as defined in the GILDAS/CLASS package. The velocity resolution at which the spectra are presented is listed in each panel.
Current usage metrics show cumulative count of Article Views (full-text article views including HTML views, PDF and ePub downloads, according to the available data) and Abstracts Views on Vision4Press platform.
Data correspond to usage on the plateform after 2015. The current usage metrics is available 48-96 hours after online publication and is updated daily on week days.
Initial download of the metrics may take a while.