Fig. 6
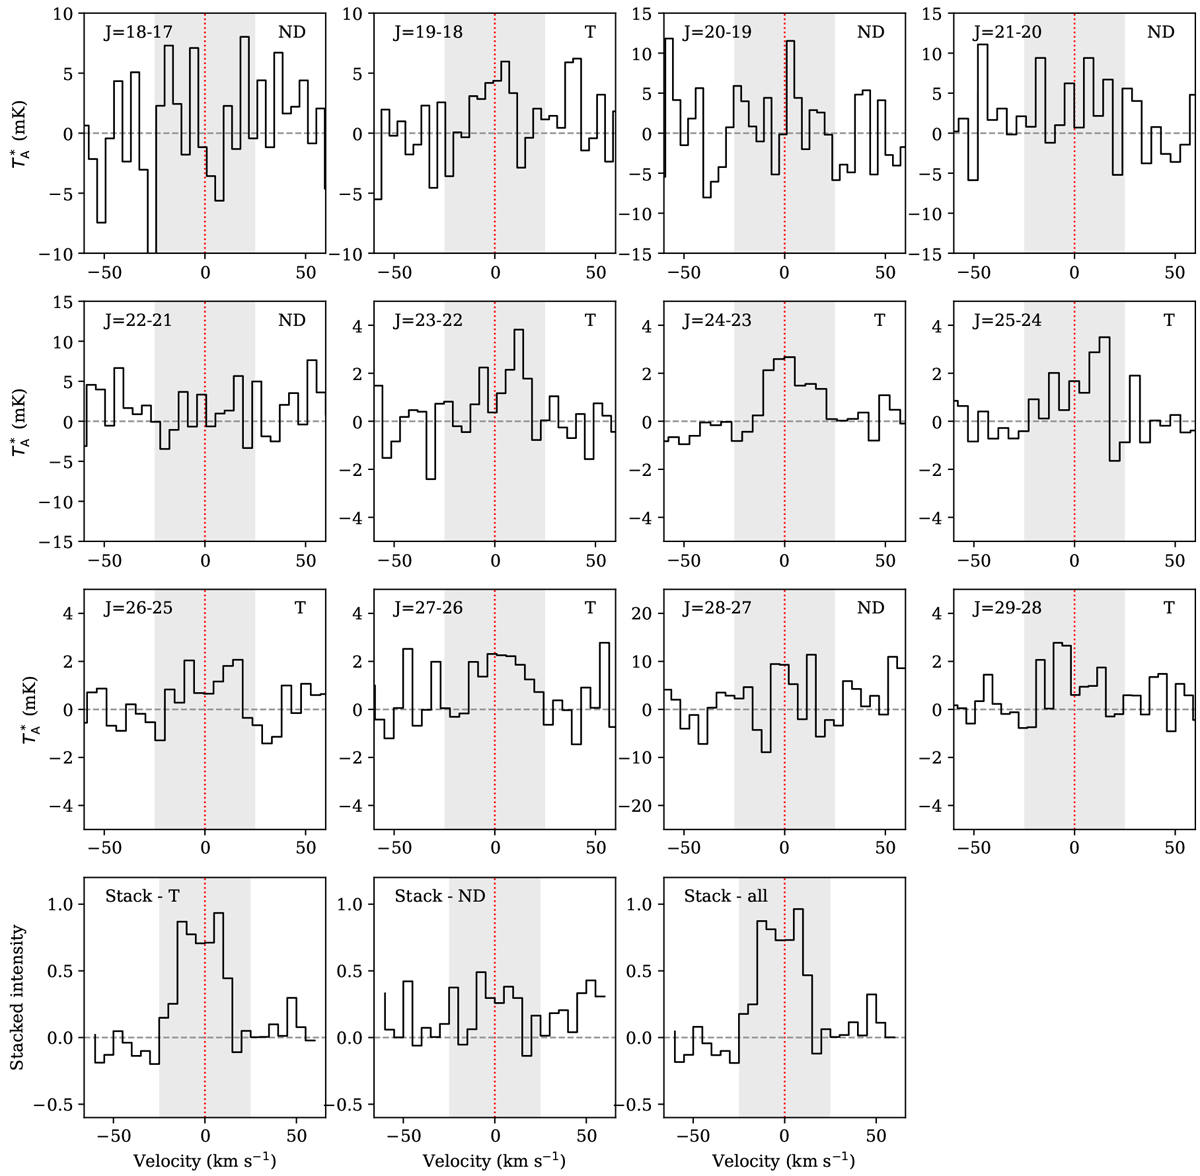
Detection of HC3N emission. Top three rows: spectra extracted around all frequencies of HC3N rotational transitions in the vibrational ground state v = 0 covered by our observations. Shaded areas indicate a velocity range [−25, 25] km s−1 around the rest frequency of the transition, and vertical red lines correspond to the rest frequency centred to a velocity of 0 km s−1. All panels are labelled with the transition and whether the line is considered tentatively detected (T) or not detected (ND). Bottom row: result of stacking the emission for selected transitions, aligned in velocity space: left: tentatively identified transitions (marked T), middle: transitions not detected (marked ND), right: all twelve transitions shown in the top three rows. We note that the intensity scale is normalised to the peak and has no physical meaning as such.
Current usage metrics show cumulative count of Article Views (full-text article views including HTML views, PDF and ePub downloads, according to the available data) and Abstracts Views on Vision4Press platform.
Data correspond to usage on the plateform after 2015. The current usage metrics is available 48-96 hours after online publication and is updated daily on week days.
Initial download of the metrics may take a while.