Fig. 5
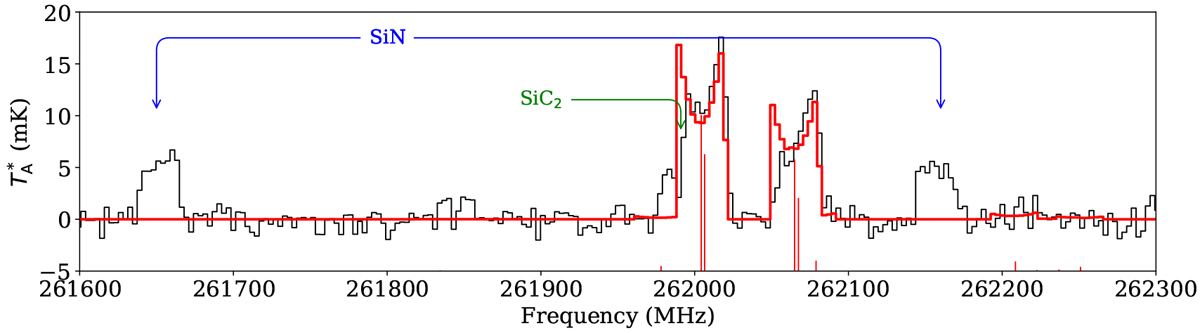
C2H and SiN emission. High-signal-to-noise ratio detection of C2H (3−2) in the PI230 data, plotted at 3.0 MHz (≈3.5 km s−1) spectral resolution. Vertical red lines indicate the position and relative strength of the hyperfine structure components of the rotational transition of C2H. In red, we overplot a synthetic spectrum of C2H (3−2) using a “shell” profile as described in the GILDAS/CLASS manual, fitted to the data by eye, using the intrinsic component strengths. In blue we indicate the location of the strongest components of the SiN (N = 6−5) transition; see Fig. B.6 for all detected SiN emission. We mark the rest frequency of SiC2 (120,12−110,11) in green.
Current usage metrics show cumulative count of Article Views (full-text article views including HTML views, PDF and ePub downloads, according to the available data) and Abstracts Views on Vision4Press platform.
Data correspond to usage on the plateform after 2015. The current usage metrics is available 48-96 hours after online publication and is updated daily on week days.
Initial download of the metrics may take a while.