Fig. 3
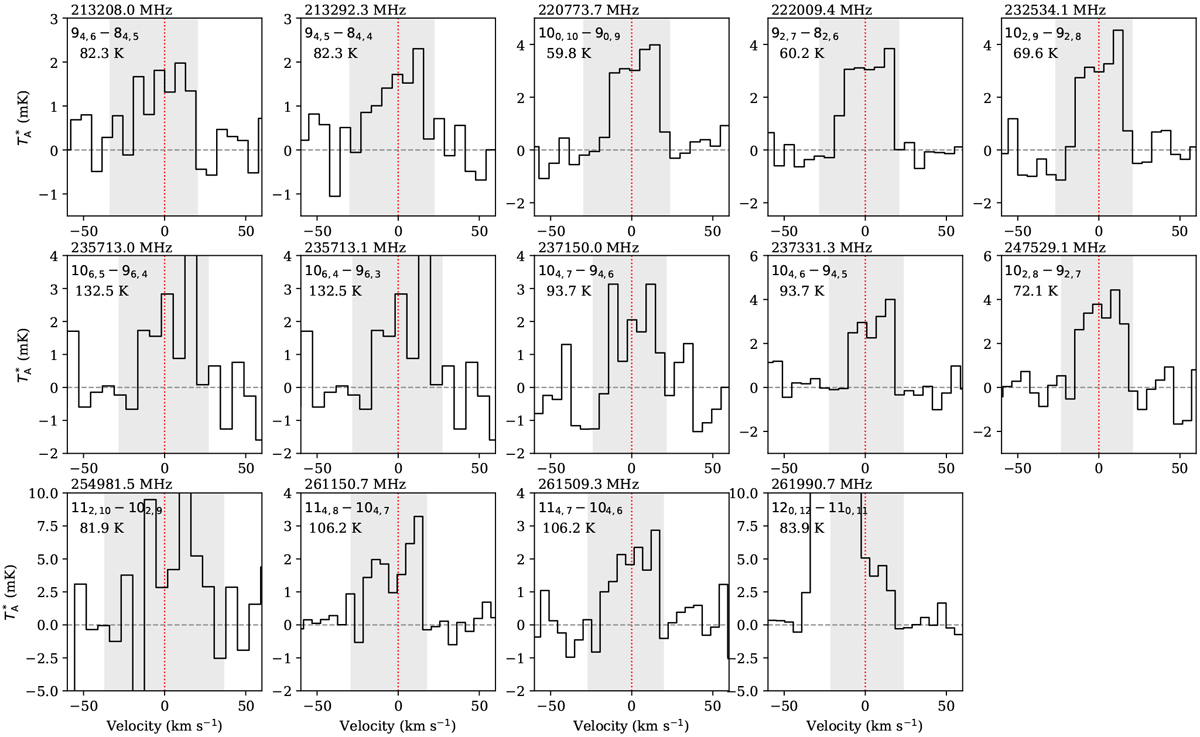
SiC2 emission. Shaded areas indicate the part of the spectrum integrated to obtain the intensities used to construct the rotational diagram in Fig. 4, and vertical red lines correspond to the rest frequency, centred to a velocity of 0 km s−1. We give the rest frequency, quantum numbers, and upper level energy for each transition. We note that (i) the rest frequencies of the 106,5−96,4 and 106,4−96,3 lines at 235.7 GHz differ by only 0.1 MHz and (ii) the emission from the 120,12 − 110,11 transition at 261.991 GHz (last panel) is blended with intense C2H emission (Fig. 5) and is therefore omitted from the rotational diagram analysis, as is the 112,10 − 102,9 transition which is tentatively detected in a region of high rms noise.
Current usage metrics show cumulative count of Article Views (full-text article views including HTML views, PDF and ePub downloads, according to the available data) and Abstracts Views on Vision4Press platform.
Data correspond to usage on the plateform after 2015. The current usage metrics is available 48-96 hours after online publication and is updated daily on week days.
Initial download of the metrics may take a while.