Fig. 5
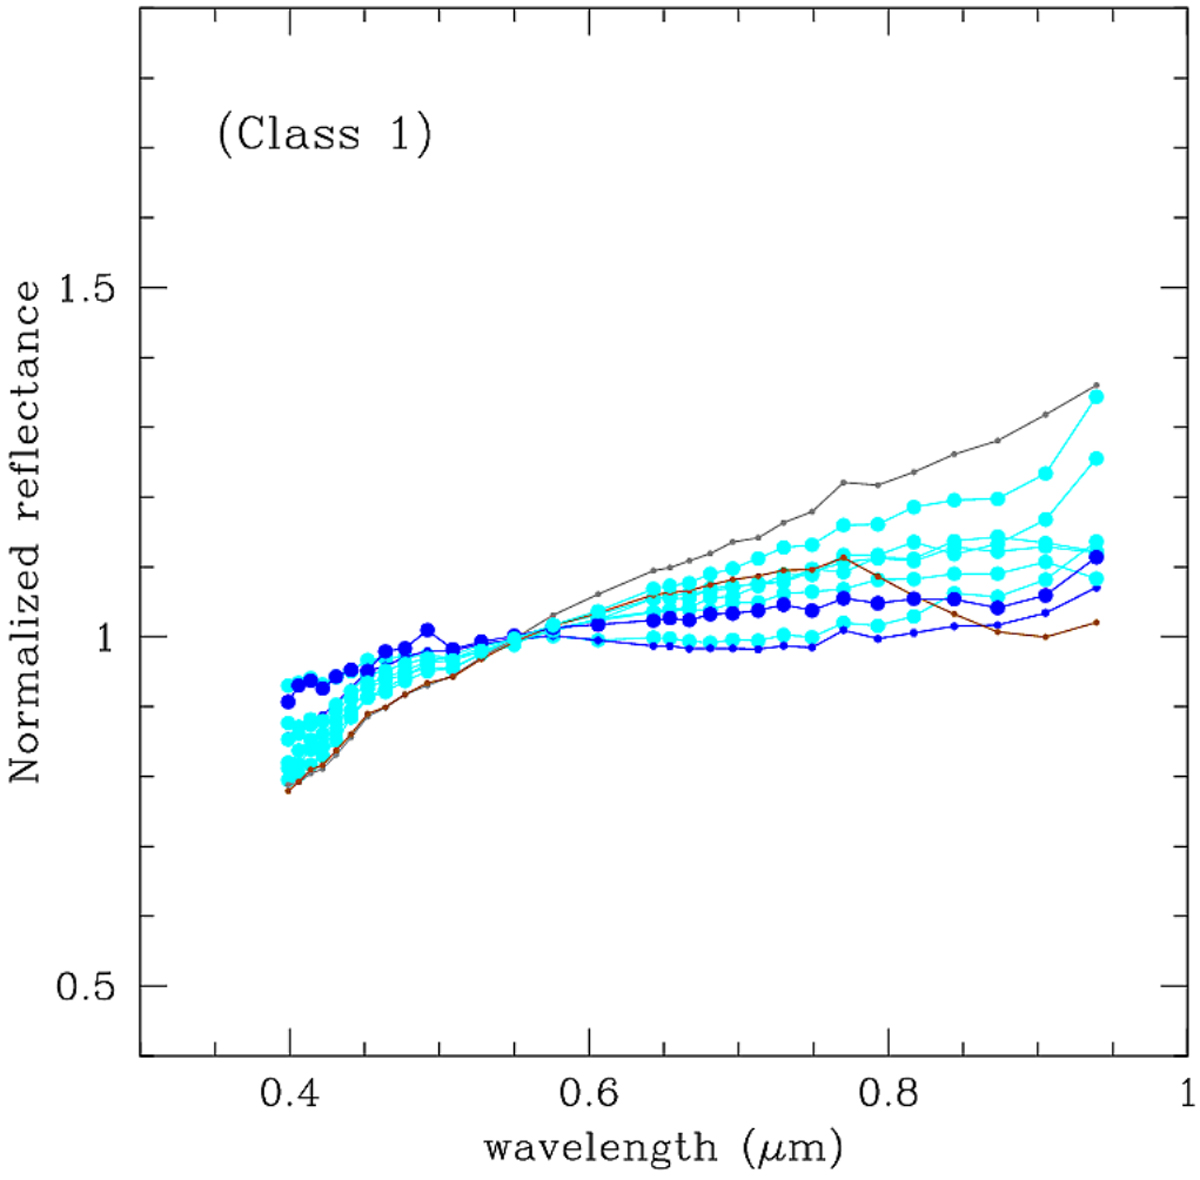
TNG normalised reflectance spectra of the selected asteroids whose clones are found in the resulting Class 01. Parent spectra whose clones exclusively (or the vast majority) belong to Class 01 are plotted in cyan. Parent spectra of clones mostly contributing to Class 02 are plotted in blue. Parent spectra providing only very minor contributions to Class 01 are plotted with small symbols. The black colour refers to very small numbers of clones of parent bodies mostly contributingto classes other than Class 01 or Class 02.
Current usage metrics show cumulative count of Article Views (full-text article views including HTML views, PDF and ePub downloads, according to the available data) and Abstracts Views on Vision4Press platform.
Data correspond to usage on the plateform after 2015. The current usage metrics is available 48-96 hours after online publication and is updated daily on week days.
Initial download of the metrics may take a while.