| Issue |
A&A
Volume 642, October 2020
|
|
|---|---|---|
| Article Number | A42 | |
| Number of page(s) | 8 | |
| Section | Stellar structure and evolution | |
| DOI | https://doi.org/10.1051/0004-6361/202038193 | |
| Published online | 02 October 2020 | |
Revisiting the thermal relaxation of neutron stars
1
Instituto de Física, Universidade Federal Fluminense, 24210-346 Niterói, RJ, Brazil
e-mail: This email address is being protected from spambots. You need JavaScript enabled to view it.
2
Departamento de Física, Instituto Tecnológico de Aeronáutica, DCTA, 12228-900 São José dos Campos, SP, Brazil
Received:
17
April
2020
Accepted:
8
July
2020
Abstract
In this work, we revisit the thermal relaxation process for neutron stars. Such a process is associated with the thermal coupling between the core and the crust of neutron stars. The thermal relaxation, which takes place at around 10–100 years, is manifested as a sudden drop in the star’s surface temperature. Such a drop is smooth for slowly cooling objects and very sharp for fast-cooling ones. In our study, we focused particularly on the cooling of neutron stars whose mass is slightly greater than the value above which the direct Urca (DU) process sets in. Considering different mechanisms for neutrino production in each region of the star, and working with equations of state with different properties, we solved the thermal evolution equation and calculated the thermal relaxation time for an ample range of neutron star masses. By performing a comprehensive study of neutron stars just above the onset of the DU process, we show that stars under these conditions exhibit a peculiar thermal relaxation behavior. We demonstrate that such stars exhibit an abnormally late relaxation time, characterized by a second drop in its surface temperature taking place a later age. We qualified such behavior by showing that it is associated with limited spatial distribution of the DU process in such stars. We show that as the star’s mass increases, the DU region also grows, and the star exhibits the expected behavior of fast-cooling stars. Finally, we show that one can expect high relaxation times for stars in which the DU process takes place in a radius no larger than 3 km.
Key words: stars: neutron / stars: evolution / stars: interiors
© ESO 2020
1. Introduction
The cooling of neutron stars has proven to be a fantastic way of probing the interior of these objects. Many works were dedicated to investigating several aspects of this rich and complicated phenomena (Tsuruta & Cameron 1965; Maxwell 1979; Horvath et al. 1991; Schaab et al. 1996; Page et al. 2004, 2006, 2011; Grigorian et al. 2005; Negreiros et al. 2013, 2017, 2018). Our current understanding of the thermal evolution of these objects tells us that they cool down mainly due to two mechanisms: neutrino emission from their interior, and photon emission from the surface (for a comprehensive review, see Yakovlev & Pethick 2004; Page et al. 2004, 2009). Initially, the neutrino emission from the interior dominates the cooling. After this neutrino dominated era, when the interiors are cool enough that neutrino emission becomes less relevant, the cooling is driven by photon emission from its surface. Furthermore, the significant differences between the structure of the star’s core and crust (the former is composed of a degenerate interacting gas, whereas the latter is mostly crystalline) lead to a thermal decoupling between them. Due to stronger emission, the core acts as a heat sink, absorbing part of the crust’s heat (while the other part is radiated away at the surface and by crustal neutrino emission). Eventually, the core and the crust become thermally coupled, a process that is signaled by a drop in the surface temperature of the star (Lattimer et al. 1994; Potekhin et al. 1997; Gnedin et al. 2001). The drop in temperature is more or less accentuated according to how strong the neutrino emission in the core is. Usually, stars in which the powerful direct Urca (DU) process takes place exhibit a significant and sharp temperature drop, whereas stars without the DU process experience a much smoother thermal evolution (Page & Baron 1990; Lattimer et al. 1991; Yakovlev et al. 2001). It is this sudden surface temperature change that is used to define the thermal relaxation time.
Previous works (Lattimer et al. 1994; Gnedin et al. 2001) have found that the thermal relaxation time depends on microscopic properties of the star, such as thermal conductivity and specific heat. It was also found that it depends on macroscopic properties such as stellar radius and crust thickness. We also note that the authors of Blaschke et al. (2004) conducted an extensive investigation of the cooling of hadronic stars. Although their work had a different scope, they also explored the thermal relaxation of neutron stars under the context of different cooling regulators. In this work, we revisit the thermal processes that lead to the thermal relaxation. We show that while our results agree with the previous studies, we identified a new behavior: stars exhibit an abnormally high thermal relaxation time. Our work identifies that this transient behavior is typical of stars just above the onset of the DU process. We show that this is associated with the small regions in which the DU process is active is such stars (as opposed to larger regions in more massive stars, or complete absence for lower mass objects). We see that for the stars in which the DU is not pervasive, thermal relaxation can take much longer – and that these stars exhibit thermal behavior typical of stars with and without a DU process.
In order to perform this study, we made use of several microscopic models that have been extensively used and tested for modeling neutron stars (Dutra et al. 2014; Lourenco et al. 2019). From the pool of models studied in Dutra et al. (2014); Lourenco et al. (2019), we chose four: BSR8, BSR9, G2*, and IU-FSU – all of them allow for the DU process to set in at reasonable neutron star masses (between 1.0 and 2.0 solar masses). Furthermore, all of them present microscopic properties different enough to allow us to conclude that the results we find are most likely general. The same behavior is shared among all models studied, with the only difference being the star’s mass at which the DU process becomes available.
This paper is divided as follows: in Sect. 2 we discuss the microscopic models used, Sect. 3 is devoted to the review of the thermal evolution of neutron stars, Sect. 4 contains our results for the relaxation time of neutron stars at the onset of the direct Urca process, and in Sect. 5 we present our conclusions.
2. Microscopic models
Quantum hadrodynamics (QHD) is a powerful tool used to build models that represent the strongly interacting matter with hadrons being the main degrees of freedom. The first model constructed from such an approach was proposed by Walecka (1974) and Serot & Walecka (1997) with the two free parameters fixed to reproduce the nuclear matter energy per particle as a function of the density, and a minimum of B0 = −15.75 MeV at the saturation density ρ0 = 0.19 fm−3. However, the model also presents bad results for the effective mass ratio and incompressibilty, both at ρ = ρ0, namely,  (Mn is the nucleon rest mass) and K0 = 540 MeV, respectively. Over the years, many other improved versions of this model were proposed in which
  and K0 are fixed to more compatible values with experimental/theoretical predictions. Furthermore, other bulk parameters at the saturation density are also used in order to constrain the free coupling constants of these microscopic models.
Here, we investigate the cooling process of neutron stars based on parametrizations of a general model described by the following Lagrangian density (Dutra et al. 2014; Li et al. 2008)
 (1)
(1)
in which Fμν = ∂μων − ∂νωμ and Bμν = ∂μρν − ∂νρμ. ψ is the nucleon field and σ, ωμ, and ρμ represent the fields of the mesons σ, ω, and ρ, respectively. The mean-field approximation is used in order to solve the equations of motion for the fields. This procedure, along with the energy-momentum tensor, Tμν, allows the construction of all thermodynamics of the system since the energy density and pressure are given by ℰ = ⟨T00⟩ and P = ⟨Tii⟩/3, respectively. These equations of state are evaluated, as a function of the density, by taking into account the auto-consistency of the field equations and the definition of the effective nucleon mass given by M* = Mn − gσσ. More details related to the calculations of these quantities can be found in Dutra et al. (2014) and Li et al. (2008), and references therein.
In order to study neutron stars and their thermal evolution, it is necessary to construct stellar matter by imposing charge neutrality and β-equilibrium. This leads to the following conditions for chemical potentials and densities: μn − μp = μe = μμ and ρp − ρe = ρμ, where ![Mathematical equation: $ \rho_l=[(\mu_l^2 - m_l^2)^{3/2}]/(3\pi^2) $](/articles/aa/full_html/2020/10/aa38193-20/aa38193-20-eq4.gif) , for l = e, μ, and μe = (3π2ρe)1/3. The total energy density and pressure of β-equilibrated stellar matter is then given by ε = ℰ + ℰe + ℰμ and p = P + Pe + Pμ, respectively. The chemical potentials and densities of protons, neutrons, electrons, and muons are given, respectively, by μp, μn, μe, μμ, and ρp, ρn, ρe, ρμ, with y = ρp/ρ = ρp/(ρp + ρn). Some neutron star properties, such as the mass-radius profile, are obtained through the solution of the Tolman-Oppenheimer-Volkoff (TOV) equations (Tolman 1939; Oppenheimer & Volkoff 1939) given by dp(r)/dr = −[ε(r)+p(r)][m(r)+4πr3p(r)]/r2f(r) and dm(r)/dr = 4πr2ε(r), where f(r) = 1 − 2m(r)/r.
, for l = e, μ, and μe = (3π2ρe)1/3. The total energy density and pressure of β-equilibrated stellar matter is then given by ε = ℰ + ℰe + ℰμ and p = P + Pe + Pμ, respectively. The chemical potentials and densities of protons, neutrons, electrons, and muons are given, respectively, by μp, μn, μe, μμ, and ρp, ρn, ρe, ρμ, with y = ρp/ρ = ρp/(ρp + ρn). Some neutron star properties, such as the mass-radius profile, are obtained through the solution of the Tolman-Oppenheimer-Volkoff (TOV) equations (Tolman 1939; Oppenheimer & Volkoff 1939) given by dp(r)/dr = −[ε(r)+p(r)][m(r)+4πr3p(r)]/r2f(r) and dm(r)/dr = 4πr2ε(r), where f(r) = 1 − 2m(r)/r.
We chose to study parametrizations of the relativistic mean-field (RMF) model described by Eq. (1) that lead to the onset of the DU process (Lattimer et al. 1991; Yakovlev et al. 2001) at densities associated with a relatively wide range of stellar masses (see next section for more details), namely, BSR8 (Dhiman et al. 2007), BSR9 (Dhiman et al. 2007), G2* (Sulaksono & Mart 2006), and IU-FSU (Fattoyev et al. 2010). Their main bulk properties (at the saturation density), as well as the predicted maximum mass (Mmax) and radius of the M = 1.44M⊙ neutron star (R1.44), are listed in Table 1.
Bulk parameters of the RMF parametrizations used in our study, along with their respective maximum neutron star masses and radii of the M = 1.44 M⊙ neutron star.
The isovector bulk parameters shown in that table are J = 𝒮(ρ0) (symmetry energy at ρ0), L0 = L(ρ0) (symmetry energy slope at ρ0), and  (symmetry energy curvature at ρ0), with 𝒮(ρ) = (1/8)(∂2E/∂y2)|y = 1/2, L0 = 3ρ0(∂𝒮/∂ρ)ρ0,
  , and E(ρ) = ℰ/ρ. These specific parametrizations were selected out of 35 others shown to be consistent with constraints related to nuclear matter, pure neutron matter, and symmetry energy and its derivatives, in an analysis that investigated a larger set of 263 RMF parametrizations (Dutra et al. 2014).
We note that the microscopic models used in this study have been previously confronted with observed neutron star data (Dutra et al. 2016). We now briefly describe the results obtained, beginning with the neutron star mass. The most massive neutron stars observed are associated with pulsars PSR J1614-2230 and PSR J0348+0432 with masses of 1.97 ± 0.04 M⊙ and 2.01 ± 0.04 M⊙, respectively (Demorest et al. 2010; Antoniadis et al. 2013). The maximum mass predicted for each of the models studied is listed in Table 1. As discussed in (Dutra et al. 2016), the models are within the lower bounds of the observational range.
It is also worth mentioning that for the microscopic models used in our study, one obtains the radius for a 1.44 M⊙ neutron star given in Table 1. When confronted with recent estimates of the radius of a 1.44 M⊙ neutron star by NICER, given by  km (Raaijmakers et al. 2019) and
  km (Miller et al. 2019), one sees that all of them are within the estimated range of radii.
Finally, the models studied here have been analysed in Lourenco et al. (2019) with respect to the dimensional tidal deformability (Λ), estimated by the observation of the GW170817 event. It was found that G2* and IU-FSU parametrizations completely satisfy the limits of 70 ≤ Λ1.4 ≤ 580 and the Λ1 × Λ2 region related to the two neutron stars of the GW170817 binary system. We also mention that the remaining BSR8 and BSR9 models present partial agreement concerning the latter constraint.
3. Cooling of neutron stars
The cooling of neutron stars is driven by the emission of neutrinos and photons, the former being emitted from the stellar core, and the latter from the surface. The thermal evolution equations for a spherically symmetric, relativistic star, with geometric unit system (G = c = 1), are given by
 (2)
(2)
 (3)
(3)
Details of the derivation of such equations can be found in Page et al. (2006), Weber (1999), and Schaab et al. (1996). One must also note that the cooling of neutron stars strongly depends on both micro and macroscopic properties of the star, which makes thermal evolution studies a fantastic way of probing compact star properties. Quantities that are of extreme importance to calculate the cooling are the neutrino emissivity (ϵν(r, T)) and specific heat (cv(r, T)), all of which depend on microscopic information of the underlying model. Of particular importance to this study is the thermal conductivity (κ(r, T)), which were thoroughly studied in Flowers & Itoh (1976, 1979, 1981) and were further explored in Gnedin & Yakovlev (1995). In addition, macroscopic properties such as radial distance (r), mass (m(r)), curvature (ϕ(r)), temperature T(r, t), and luminosity (l(r, t)) are also needed for the solution of Eqs. (2) and (3).
The boundary conditions for the solution of Eqs. (2) and (3) are given by a vanishing heat flow at the star’s center L(r = 0) = 0 and by the relationship between the surface luminosity and the mantle temperature. The latter condition depends on the surface properties of the star and its composition, and it is discussed in detail in Gudmundsson (1982) and Gudmundsson et al. (1983).
This study takes into account all neutrino emission processes allowed to happen in accordance with our current understanding. For a detailed review of such processes, we direct the reader to Yakovlev et al. (2001) and Yakovlev & Pethick (2004).
We would like to point out that we intentionally did not consider pairing among the star’s constituents. This is a conscious decision, so as not to cloud the object of study, namely the thermal relaxation time. Evidently we are not advocating for the absence of pairing in neutron stars, and we refer the reader to several papers on the subject (Schaab et al. 1996; Page et al. 2004, 2011; Yakovlev et al. 2001). In this work, however, we studied the thermal evolution of objects without pairing, so as to properly quantify and qualify the relaxation time of these stars. Evidently, this work should be augmented with the inclusion of pairing – which is currently underway.
Thermal relaxation. The thermal relaxation of a neutron star is characterized by the time it takes for the core and the crust to become thermally coupled. As explained in Refs. (Lattimer et al. 1994; Gnedin et al. 2001), due to the significantly different structures between the neutron star core and its crust (the latter is composed roughly of a degenerate gas and the former of a crystalline structure), their thermal conductivity and specific heat are drastically different. Furthermore, there is a strong emission of neutrinos in the core (the actual strength of the neutrino emission depends on the presence or lack of the DU process, as we discuss below). These two factors lead to the formation of cold front at the core that we can imagine “propagates” toward the surface. Once it emerges, the surface temperature of the star exhibits a sudden drop (more or less accentuated according to the presence or absence of the DU process), signaling the thermal coupling between the core and crust. Such relaxation times are typically tw ∼ 10 − 100 years, depending on stellar properties. In this work, we follow the definition of Gnedin et al. (2001) and define the relaxation time as
 (4)
(4)
The authors of Lattimer et al. (1994) and Gnedin et al. (2001) have found that the relaxation time can generally be written as
 (5)
(5)
where t1 is a normalized relaxation time that depends solely on the composition of the star. Then, α is given by
 (6)
(6)
where ΔRcrust is the crust thickness, and M and R the stellar mass and radius, respectively.
Equation (5) shows a linear dependence between the relaxation time and the quantity α, which in turn strongly depends on macroscopic properties such as crust thickness, mass, and radius. The normalized time t1 is a propotionality constant that depends on the microscopic properties, such as the specific heat and thermal conductivity of the underlying model (Gnedin et al. 2001).
These results indicate that stars with higher masses, which are associated with thinner crusts and more intense neutrino emissions from their core, have a smaller relaxation times than their low-mass counterparts – which is indeed the case as noted in Gnedin et al. (2001). One notes a substantial difference between stars that exhibit fast-cooling (generally higher mass objects with the presence of powerful neutrino emission processes such as the DU) to stars that exhibit slow-cooling (objects with lower masses). It was found that they both obey the relation (5) but have different values for the coefficient (t1), which is understandable given that such coefficient is associated with microscopic properties of the star. In this work, we investigated stars at the transition between slow and fast-cooling regimes. We see that such transition is generally nonlinear, with the onset of a fast-cooling process such as the DU giving rise to a substantial change in the thermal properties. We show in the next section that in this transition regime, stars exhibit longer thermal relaxation times than their counterparts either in the slow- or fast-cooling regimes.
4. Relaxation time at the onset of the DU process
Before we can devote our attention to the thermal behavior of stars near the onset of the DU process, we discuss the general cooling properties of the stars described by the different microscopic models described in Sect. 2. By varying the central density, we calculated a family of stars whose cooling could then be derived. Furthermore, we also identified the stars at which the DU process becomes active. We remind the reader that the DU process can only take place if the triangle inequality kfn ≤ kfp + kfe is satisfied. This usually translates to a proton fraction ∼11 − 15% (Lattimer et al. 1991; Page et al. 2006). The properties of the stars at the onset of the DU process for the models studied are shown in Table 2.
Stellar central energy density ρDU, stellar mass MDU, and proton fraction YDU, above which the DU process is active inside the star for all EoSs studied herein.
The cooling of a wide range of masses for each model studied is shown in Figs. 1–4. As we can see, all models exhibit, qualitatively, the same behavior, with lighter stars displaying slow cooling, whereas heavier ones show fast cooling. Each model has a different mass at which the DU process sets in, this can be traced back to the differences in the microscopic model, and particularly to the symmetry energy, its slope, and curvature. We must note that model IU-FSU sets itself apart due to a lower symmetry energy slope and much higher curvature. This leads the DU onset to take place at stars with much higher masses. Regardless of the microscopic model, or the mass at which the DU sets in, one can see a substantial difference in the cooling curves once it sets in. The reason behind such behavior lies in the strength of the DU process (∼1027(T9)6 erg cm−3 s, T9 being the temperature in units of 109 K), which is much higher than that of the modified Urca process (∼1021(T9)8 erg cm−3 s). Thus, even if active in just a small kernel at the stellar core, it strongly affects the thermal evolution of star, as shown in Figs. 1–4.
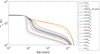 |
Fig. 1. Surface temperature as a function of age for stars of different masses under the microscopic model BSR8. |
One also sees that as the star’s mass increases, the cooling becomes faster, which can be explained by the fact that the DU kernel at the star’s center grows with the mass of the star. Eventually, the DU kernel becomes large enough that any increase in its size becomes mostly irrelevant and the cooling behavior of the star changes very little with any increase in the mass.
We now use the definition given by Eq. (4), to determine the thermal relaxation time of the stars of which the cooling is depicted in Figs. 1–4. The results are shown in Fig. 5.
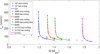 |
Fig. 5. Relaxation time as a function of gravitational mass for the different models studied. The discontinuity indicates the DU onset for each model. We note that the solid line is a fit for the nonlinear region. We omit the fit for the linear part so as not to overload the figure. |
One can see that the thermal relaxation time exhibits a highly nonlinear behavior, drastically increasing at certain values of mass and quickly decreasing to a smoother shape. The mass at which the relaxation time increases is precisely the mass at which the DU sets in (for that particular microscopic model). The overall decrease of the thermal relaxation time with the increase of the mass has already been identified in previous studies, however, in order to identify the nonlinear behavior near the DU onset, a high-resolution study of the cooling of stars just above such onset is required. This is because the DU process is not pervasive in the star’s interior, as we discuss below. To better understand the nonlinear behavior of tw, it is helpful to analyze the evolution of the derivative of lnTs, which we show in Figs. 6–9.
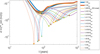 |
Fig. 6. dln(Ts)/d(ln(t)) as a function of time for the thermal evolution of stars described by the BSR8 model. The global minimum of each curve represents the thermal relaxation time. Rhombus and star symbols indicate local minima in each curve. |
It is clear that for slow-cooling stars, the relaxation process is smoother, as can be seen by the smooth minimum in the curves of Figs. 6–9, located at ∼100 years. Analyzing Figs. 6–9, we also see that as the stellar mass increases and the DU process is triggered, a second minimum appears at later times. This minimum has a larger magnitude than the first as it is associated with the DU process. It is also clear that as the mass increases (as does the region in which the DU takes place), this second minimum becomes sharper and more intense, until eventually overtaking the first smoother minimum – leading to stars with one minimum only, except this time much deeper. This indicates that stars with small DU kernels in the interiors have a “double” thermalization process. Such stars exhibit the thermal behavior typical of stars with and without the DU process. In order to explain this process, we show the temperature profile at different times for stars of different masses (all in the BSR8 model): (i) M = 1.3 M⊙ (no DU process, Fig. 10); (ii) M = 1.41 M⊙ (just above the onset of the DU, Fig. 11); and (iii) M = 1.8 M⊙ (well above the DU onset – prominent DU, Fig. 12). We note that all other models exhibit, qualitatively, the same behavior, and we omit the figures for the sake of conciseness.
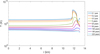 |
Fig. 10. Temperature profile inside a 1.3 solar-mass star within the BSR8 model. Each curve represents different snapshots with the age indicated in the legends. |
A careful examination of Figs. 10–12 provides an important insight into the behavior discussed above. First, we reviewed the thermal evolution of a low-mass star, such as that exhibited in Fig. 10. In such stars, the DU process is absent, thus there is no fast-cooling mechanism within. This means that the core cools down in a mostly uniform manner, and as such, by 0.1 years it is mostly isothermal. It is also relatively hot. Thus, in stars such as this one, the thermal relaxation is solely due to the thermal coupling between the core and the crust. Due to the relatively high temperature of the core, this process is slow and smooth. Now, we move on to high-mass stars, such as the 1.8 M⊙, whose temperature profiles are exhibited in Fig. 12. In these stars, the DU process takes place in a large region of their core (although not the entire core). As such, this leads to a temperature profile with a large temperature gradient between the DU and non-DU region within the core. The DU region is significantly colder and acts as a very strong heat sink due to its size and to the strength of the DU process. When the core becomes isothermal, it does so at a lower temperature when compared to the non-DU cooling. Furthermore, the core acts as a stronger heat sink, efficiently drawing heat from the crust, thus exhibiting the behavior of a strong cold front that readily reaches the surface – leading to a sudden and strong drop in surface temperature. Finally, we now turn our attention to stars just above the onset of the DU – illustrated by the M = 1.41 M⊙ star in Fig. 11. These stars have the DU process limited to a small kernel in their interiors. This can be seen in Fig. 11 as the relatively small region with a lower temperature at small radius. Due to the small size of this region, its influence on the global thermal behavior of the star is limited. As such, for the initial years, the outer core and the crust of the star behave as if there were no DU process, and the star (initially) behaves as a slow-cooling star. Eventually, the core becomes isothermal, as the influence of the DU region propagates until it reaches the surface, leading to a belated thermal relaxation. This indicates a hybrid behavior for such stars, in which at young ages it acts like a non-DU star and later exhibits a drop in its surface temperature. The result of this is an abnormally high relaxation time for stars in this transitional region. This is an exotic behavior: stars near the onset of the DU process may exhibit larger thermal relaxation times than other objects either with or without prominent fast-cooling processes.
The scenario discussed above can be further understood by analyzing the conductive luminosity (Weber 1999) within the star. This quantity is related to a fraction of the total energy of the star that is transferred via heat conduction within it. For a general relativistic star with spherical symmetry, it can be defined as
 (7)
(7)
We show in Figs. 13–15 the conductive luminosity for the three stars discussed above.
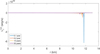 |
Fig. 13. Conductive luminosity for the 1.3 solar-mass star of the BSR8 model at different times. The high peaks indicate the large temperature gradients between the core and the crust. |
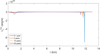 |
Fig. 14. Same as Fig. 13 but for a 1.41 M⊙ star (just above the DU onset). The high peaks at large radii represent the temperature gradient between core and crust. We also note the small nonzero conductivity at lower radii. This region is associated with the small DU kernel at the star’s core. |
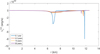 |
Fig. 15. Same as Fig. 13 but for a 1.8 M⊙ star – well above the DU onset. Besides the large peaks representing the core-crust temperature gradient, we also have a large peak representing the temperature gradient between the DU and non-DU regions of the star. |
The results of Figs. 13–15 corroborate our previous assessment. We see in Fig. 13 that the core is mostly isothermal by 0.1 years (as indicated by a mostly absent conductivity luminosity within the core), leading to very little heat transport within the core: the core-crust interface being the most prominent conductive heat sink (with the core absorbing large amounts of the crust heat). Figure 13 also shows that with the passage of time, this sink becomes smaller until a core-crust thermal equilibrium is achieved. The situation is drastically different for the 1.8 solar-mass star, in which the DU process is present in a large part of the core as shown in Fig. 15. In this star, we see that besides the core-crust heat sink, there is also a significant heat sink within the core, which is associated with the interface between the DU and non-DU regions (naturally smoother than the core-crust interface). In this system, we have a strong heat sink that reduces the temperature of the core, as well as a core that absorbs heat from the crust. Finally, in Fig. 14 we show the conductive luminosity for the 1.41 solar-mass star, which is just above the DU onset. As discussed before, this star has a hybrid behavior. We see the expected peak at the core-crust transition and a relatively small heat sink near the star’s core. This is associated with the small DU kernel present in this star. As such, this small heat sink takes longer to make itself noticeable and the star initially cools down as if there was no DU process – until the effect of this region finally reaches the crust, leading to a second belated thermal coupling indicated by the late drop in the surface temperature.
Finally, we discuss what happens as the star mass increases, and we move from this transitional behavior to the well-known fast-cooling scenario. As discussed above, after a certain point, when the DU is pervasive enough, the thermal relaxation time changes very little with the increase in mass. This can be clearly seen in Fig. 5. In order to understand how large the DU process kernel needs to be for the star to find itself outside of the transient region, we analyzed the dependence of the relaxation time on the radius of the DU kernel (the fraction of the core in which the DU takes place). In Fig. 16, we show how the thermal relaxation time changes as the radius of the DU kernel (RDU) increases (for stars of higher masses). We note that this graph is essentially analogous to the one shown in Fig. 5, as the DU kernel increases together with the mass. It is, nonetheless, useful to see the direct dependence on the size of the DU kernel, as it tells us that the thermal relaxation time stabilizes at RDU ∼ 2 − 3 km, meaning that at this point the star behaves as expected for a fast-cooling object.
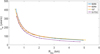 |
Fig. 16. Thermal relaxation time (tw) as a function of DU kernel’s radius – for stars with active DU in their interior. |
5. Conclusions
In this work, we revisited the concept of relaxation time for the cooling of neutron stars – we used a set of equations of state to investigate how the thermal relaxation time depends on the micro and macroscopic properties of the star. Previous studies (Gnedin et al. 2001; Lattimer et al. 1994) found a direct dependence between relaxation time and properties such as crust thickness, stellar mass, and radius. In fact, it depends linearly on a quantity denoted α, which in turn depends only on these stellar macroscopic properties: the proportionality constant in such dependence is given by t1 (see Eq. (5)) and is associated with the microscopic properties of the model adopted. Our study confirms these results, while adding a new attribute: a nonlinear increase in the relaxation time for stars near the onset of the DU process. We find that stars with masses just above that of the onset of the DU process have longer relaxation times. In order to understand this behavior, we performed an extensive analysis of the relaxation time of stars just above the onset of the DU process. We find (across all models) that as the DU process sets in, a second minimum appears at later times in the curve of dln(Ts)/d(ln(t)). We also find that as the mass increases, such a minimum becomes stronger and happens at earlier times. We identified this second minimum as a late influence of the DU process happening in small regions at the core of the stars. This is confirmed by the analysis of both the temperature distribution and the conductive luminosity inside the stars. We can see that for low-mass stars, the core is mostly isothermal and acts as a heat sink, drawing heat from the crust. As for high-mass stars with prominent DU processes in their interiors, we notice a colder core region (where the DU is active) that draws heat from the non-DU region, whereas this region draws heat from the crust. This causes a quick and strong cold front that leads to the well-known drop in surface temperature for fast-cooling stars. For stars in the transition from absent to prominent DU, we see a hybrid behavior. Due to the smaller regions in which the DU is active, the star initially behaves as if there were no DU, with a smooth coupling between core and crust, which is followed by the late arrival of the DU influence, leading to a belated thermal relaxation time. Our studies show that this is a transitional phenomenon, taking place in stars whose composition is just above the onset of the DU process. We determine that as the DU kernel in the star grows, the object returns to the expected behavior, with shorter relaxation times for higher mass stars. Our study indicates that, for DU kernels reaching a size of ∼2 − 3 km, the thermal relaxation time regains its normal and expected behavior.
We used several microscopic models for this study, covering a wide range of microscopic properties and leading to stars with different masses at the onset of the DU process. All models exhibited the same qualitative behavior, which leads us to believe this is not model dependent. As mentioned before, however, we did not take into account pairing, which considerably reduces the neutrino emissivity strength, and may even lead to the total suppression of the DU process. We opted to leave it out of this study, as the current uncertainties on pairing at high-density regimes would obscure our analysis. We stress that we do not claim pairing to be irrelevant, only that we left it out for the purpose of qualifying the phenomenon studied here. We intend to pursue further investigation of the phenomena we found here by taking account several models of superfluidity, accounting for possible proton and neutron pairings covering different regions of the star. We believe, nonetheless, that we have found an interesting phenomena, that possibly has not been seen before. It may allow neutron stars to exhibit unusually large relaxation times if their structure happens to have just reached the onset of fast neutrino emissivity, which is typically associated with the DU process. In the future, our aim is to extend this study (in addition to the aforementioned pairing) to other possible transitional phenomena, such as in hybrid stars. These objects are microscopically described by an EoS that implies a transition from hadronic matter into quark matter at a certain value of the energy density. Therefore, it may be possible that the relaxation time of hybrid stars also exhibits a nonlinear behavior for stars with a central energy density just above the onset of quark matter. Such studies are currently underway and will be discussed in future publications.
Acknowledgments
T.S. and R.N. acknowledges financial support from Coordenção de Aperfeiçoamento de Pessoal de Nível Superior (CAPES) and Conselho Nacional de Desenvolvimento Científico e Tecnológico (CNPq). R.N. acknowledges financial support from CAPES, CNPq, and FAPERJ. This work is part of the project INCT-FNA Proc. No. 464898/2014-5 as well as FAPERJ JCNE Proc. No. E-26/203.299/2017. This work is also partially supported by CNPq under grants 310242/2017-7 and 406958/2018-1 (O.L.), 433369/2018-3 (M.D.), and by Fundação de Amparo à Pesquisa do Estado de São Paulo (FAPESP) under the thematic project 2013/26258-4 (O.L.) and 2017/05660-0 (O.L., M.D.).
References
- Antoniadis, J., Freire, P. C. C., Wex, N., et al. 2013, Science, 340, 448 [Google Scholar]
- Blaschke, D., Grigorian, H., & Voskresensky, D. N. 2004, A&A, 424, 979 [NASA ADS] [CrossRef] [EDP Sciences] [Google Scholar]
- Demorest, P. B., Pennucci, T., Ransom, S. M., Roberts, M. S. E., & Hessels, J. W. T. 2010, Nature, 467, 1081 [Google Scholar]
- Dhiman, S. K., Kumar, R., & Agrawal, B. K. 2007, Phys. Rev. C, 76, 045801 [NASA ADS] [CrossRef] [Google Scholar]
- Dutra, M., Lourenco, O., Avancini, S. S., et al. 2014, Phys. Rev. C, 90, 055203 [NASA ADS] [CrossRef] [Google Scholar]
- Dutra, M., Lourenco, O., & Menezes, D. P. 2016, Phys. Rev. C, 93, 025806 [NASA ADS] [CrossRef] [Google Scholar]
- Fattoyev, F. J., Horowitz, C. J., Piekarewicz, J., & Shen, G. 2010, Phys. Rev. C, 82, 055803 [Google Scholar]
- Flowers, E., & Itoh, N. 1976, ApJ, 206, 218 [NASA ADS] [CrossRef] [Google Scholar]
- Flowers, E., & Itoh, N. 1979, ApJ, 230, 847 [NASA ADS] [CrossRef] [Google Scholar]
- Flowers, E., & Itoh, N. 1981, ApJ, 250, 750 [NASA ADS] [CrossRef] [Google Scholar]
- Gnedin, O., & Yakovlev, D. 1995, Nucl. Phys. A, 582, 697 [NASA ADS] [CrossRef] [Google Scholar]
- Gnedin, O. Y., Yakovlev, D. G., & Potekhin, A. Y. 2001, MNRAS, 324, 725 [NASA ADS] [CrossRef] [Google Scholar]
- Grigorian, H., Blaschke, D., & Voskresensky, D. 2005, Phys. Rev. C, 71, 045801 [NASA ADS] [CrossRef] [Google Scholar]
- Gudmundsson, E. 1982, ApJ, 259, L19 [NASA ADS] [CrossRef] [Google Scholar]
- Gudmundsson, E. H., Pethick, C. J., & Epstein, R. I. 1983, ApJ, 272, 286 [NASA ADS] [CrossRef] [Google Scholar]
- Horvath, J., Benvenuto, O., & Vucetich, H. 1991, Phys. Rev. D, 44, 3797 [CrossRef] [Google Scholar]
- Lattimer, J. M., Pethick, C., Prakash, M., & Haensel, P. 1991, Phys. Rev. Lett., 66, 2701 [NASA ADS] [CrossRef] [PubMed] [Google Scholar]
- Lattimer, J. M., van Riper, K. A., Prakash, M., & Prakash, M. 1994, ApJ, 425, 802 [NASA ADS] [CrossRef] [Google Scholar]
- Li, B.-A., Chen, L.-W., & Ko, C. M. 2008, Phys. Rep., 464, 113 [NASA ADS] [CrossRef] [Google Scholar]
- Lourenco, O., Dutra, M., Lenzi, C. H., Flores, C. V., & Menezes, D. P. 2019, Phys. Rev. C, 99, 045202 [NASA ADS] [CrossRef] [Google Scholar]
- Maxwell, O. V. 1979, ApJ, 231, 201 [NASA ADS] [CrossRef] [Google Scholar]
- Miller, M. C., Lamb, F. K., Dittmann, A. J., et al. 2019, ApJ, 887, L24 [Google Scholar]
- Negreiros, R., Schramm, S., & Weber, F. 2013, Phys. Lett. B, 718, 1176 [NASA ADS] [CrossRef] [EDP Sciences] [Google Scholar]
- Negreiros, R., Schramm, S., & Weber, F. 2017, A&A, 603, A44 [NASA ADS] [CrossRef] [EDP Sciences] [Google Scholar]
- Negreiros, R., Tolos, L., Centelles, M., Ramos, A., & Dexheimer, V. 2018, ApJ, 863, 104 [NASA ADS] [CrossRef] [Google Scholar]
- Oppenheimer, J. R., & Volkoff, G. M. 1939, Phys. Rev., 55, 374 [NASA ADS] [CrossRef] [Google Scholar]
- Page, D., & Baron, E. 1990, ApJ, 354, L17 [NASA ADS] [CrossRef] [Google Scholar]
- Page, D., Lattimer, J. M., Prakash, M., & Steiner, A. W. 2004, ApJS, 155, 623 [NASA ADS] [CrossRef] [Google Scholar]
- Page, D., Geppert, U., & Weber, F. 2006, Nucl. Phys. A, 777, 497 [NASA ADS] [CrossRef] [Google Scholar]
- Page, D., Lattimer, J. M., Prakash, M., & Steiner, A. W. 2009, ApJ, 707, 1131 [NASA ADS] [CrossRef] [Google Scholar]
- Page, D., Prakash, M., Lattimer, J. M., & Steiner, A. W. 2011, Phys. Rev. Lett., 106, 081101 [NASA ADS] [CrossRef] [MathSciNet] [PubMed] [Google Scholar]
- Potekhin, A. Y., Chabrier, G., & Yakovlev, D. G. 1997, A&A, 323, 415 [NASA ADS] [Google Scholar]
- Raaijmakers, G., Riley, T. E., Watts, A. L., et al. 2019, ApJ, 887, L22 [CrossRef] [Google Scholar]
- Schaab, C., Weber, F., Weigel, M. K., & Glendenning, N. K. 1996, Nucl. Phys. A, 605, 531 [NASA ADS] [CrossRef] [Google Scholar]
- Serot, B. D., & Walecka, J. D. 1997, Int. J. Mod. Phys. E, 06, 515 [NASA ADS] [CrossRef] [Google Scholar]
- Sulaksono, A., & Mart, T. 2006, Phys. Rev. C, 74, 045806 [NASA ADS] [CrossRef] [Google Scholar]
- Tolman, R. C. 1939, Phys. Rev., 55, 364 [NASA ADS] [CrossRef] [Google Scholar]
- Tsuruta, S., & Cameron, A. G. W. 1965, Nature, 207, 364 [NASA ADS] [CrossRef] [Google Scholar]
- Walecka, J. D. 1974, Ann. Phys., 83, 491 [NASA ADS] [CrossRef] [Google Scholar]
- Weber, F. 1999, Pulsars as Astrophysical Laboratories for Nuclear and Particle Physics (Bristol, UK: Institute of Physics) [Google Scholar]
- Yakovlev, D., & Pethick, C. 2004, ARA&A, 42, 169 [NASA ADS] [CrossRef] [EDP Sciences] [MathSciNet] [Google Scholar]
- Yakovlev, D., Kaminker, A., Gnedin, O., & Haensel, P. 2001, Phys. Rep., 354, 1 [NASA ADS] [CrossRef] [Google Scholar]
All Tables
Bulk parameters of the RMF parametrizations used in our study, along with their respective maximum neutron star masses and radii of the M = 1.44 M⊙ neutron star.
Stellar central energy density ρDU, stellar mass MDU, and proton fraction YDU, above which the DU process is active inside the star for all EoSs studied herein.
All Figures
|
Fig. 1. Surface temperature as a function of age for stars of different masses under the microscopic model BSR8. |
| In the text | |
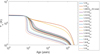 |
Fig. 2. Same as Fig. 1, but for model BSR9. |
| In the text | |
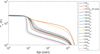 |
Fig. 3. Same as Fig. 1, but for model G2*. |
| In the text | |
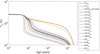 |
Fig. 4. Same as Fig. 1, but for model IU-FSU. |
| In the text | |
|
Fig. 5. Relaxation time as a function of gravitational mass for the different models studied. The discontinuity indicates the DU onset for each model. We note that the solid line is a fit for the nonlinear region. We omit the fit for the linear part so as not to overload the figure. |
| In the text | |
|
Fig. 6. dln(Ts)/d(ln(t)) as a function of time for the thermal evolution of stars described by the BSR8 model. The global minimum of each curve represents the thermal relaxation time. Rhombus and star symbols indicate local minima in each curve. |
| In the text | |
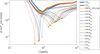 |
Fig. 7. Same as Fig. 6, but for model BSR9. |
| In the text | |
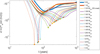 |
Fig. 8. Same as Fig. 6, but for model G2*. |
| In the text | |
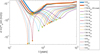 |
Fig. 9. Same as Fig. 6, but for model IU-FSU. |
| In the text | |
|
Fig. 10. Temperature profile inside a 1.3 solar-mass star within the BSR8 model. Each curve represents different snapshots with the age indicated in the legends. |
| In the text | |
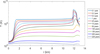 |
Fig. 11. Same as Fig. 10 but for a 1.41 M⊙ star. |
| In the text | |
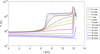 |
Fig. 12. Same as Fig. 10 but for a 1.8 M⊙ star. |
| In the text | |
|
Fig. 13. Conductive luminosity for the 1.3 solar-mass star of the BSR8 model at different times. The high peaks indicate the large temperature gradients between the core and the crust. |
| In the text | |
|
Fig. 14. Same as Fig. 13 but for a 1.41 M⊙ star (just above the DU onset). The high peaks at large radii represent the temperature gradient between core and crust. We also note the small nonzero conductivity at lower radii. This region is associated with the small DU kernel at the star’s core. |
| In the text | |
|
Fig. 15. Same as Fig. 13 but for a 1.8 M⊙ star – well above the DU onset. Besides the large peaks representing the core-crust temperature gradient, we also have a large peak representing the temperature gradient between the DU and non-DU regions of the star. |
| In the text | |
|
Fig. 16. Thermal relaxation time (tw) as a function of DU kernel’s radius – for stars with active DU in their interior. |
| In the text | |
Current usage metrics show cumulative count of Article Views (full-text article views including HTML views, PDF and ePub downloads, according to the available data) and Abstracts Views on Vision4Press platform.
Data correspond to usage on the plateform after 2015. The current usage metrics is available 48-96 hours after online publication and is updated daily on week days.
Initial download of the metrics may take a while.