Free Access
Fig. 14.
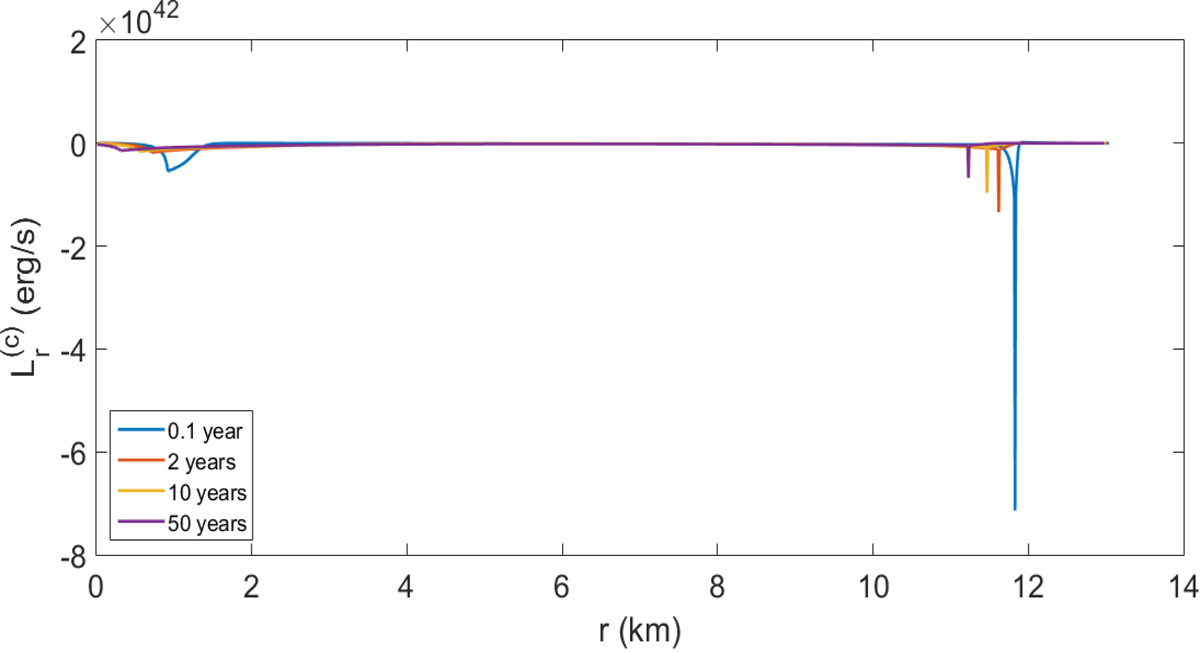
Same as Fig. 13 but for a 1.41 M⊙ star (just above the DU onset). The high peaks at large radii represent the temperature gradient between core and crust. We also note the small nonzero conductivity at lower radii. This region is associated with the small DU kernel at the star’s core.
Current usage metrics show cumulative count of Article Views (full-text article views including HTML views, PDF and ePub downloads, according to the available data) and Abstracts Views on Vision4Press platform.
Data correspond to usage on the plateform after 2015. The current usage metrics is available 48-96 hours after online publication and is updated daily on week days.
Initial download of the metrics may take a while.