Free Access
Fig. 5.
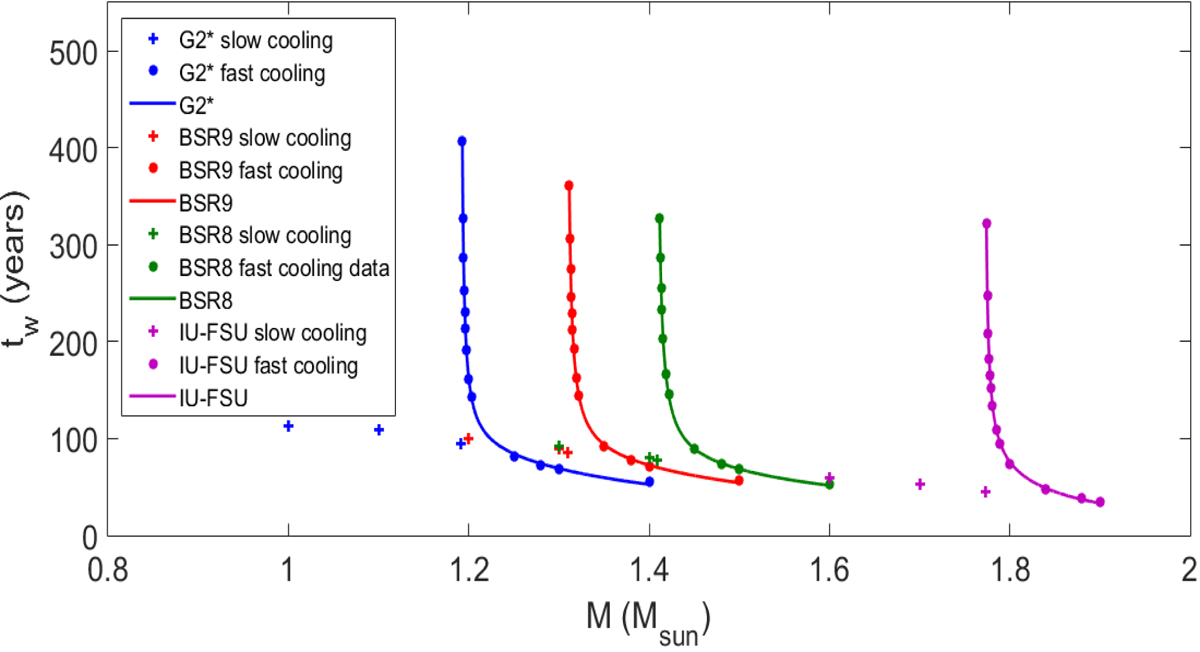
Relaxation time as a function of gravitational mass for the different models studied. The discontinuity indicates the DU onset for each model. We note that the solid line is a fit for the nonlinear region. We omit the fit for the linear part so as not to overload the figure.
Current usage metrics show cumulative count of Article Views (full-text article views including HTML views, PDF and ePub downloads, according to the available data) and Abstracts Views on Vision4Press platform.
Data correspond to usage on the plateform after 2015. The current usage metrics is available 48-96 hours after online publication and is updated daily on week days.
Initial download of the metrics may take a while.