Fig. 4.
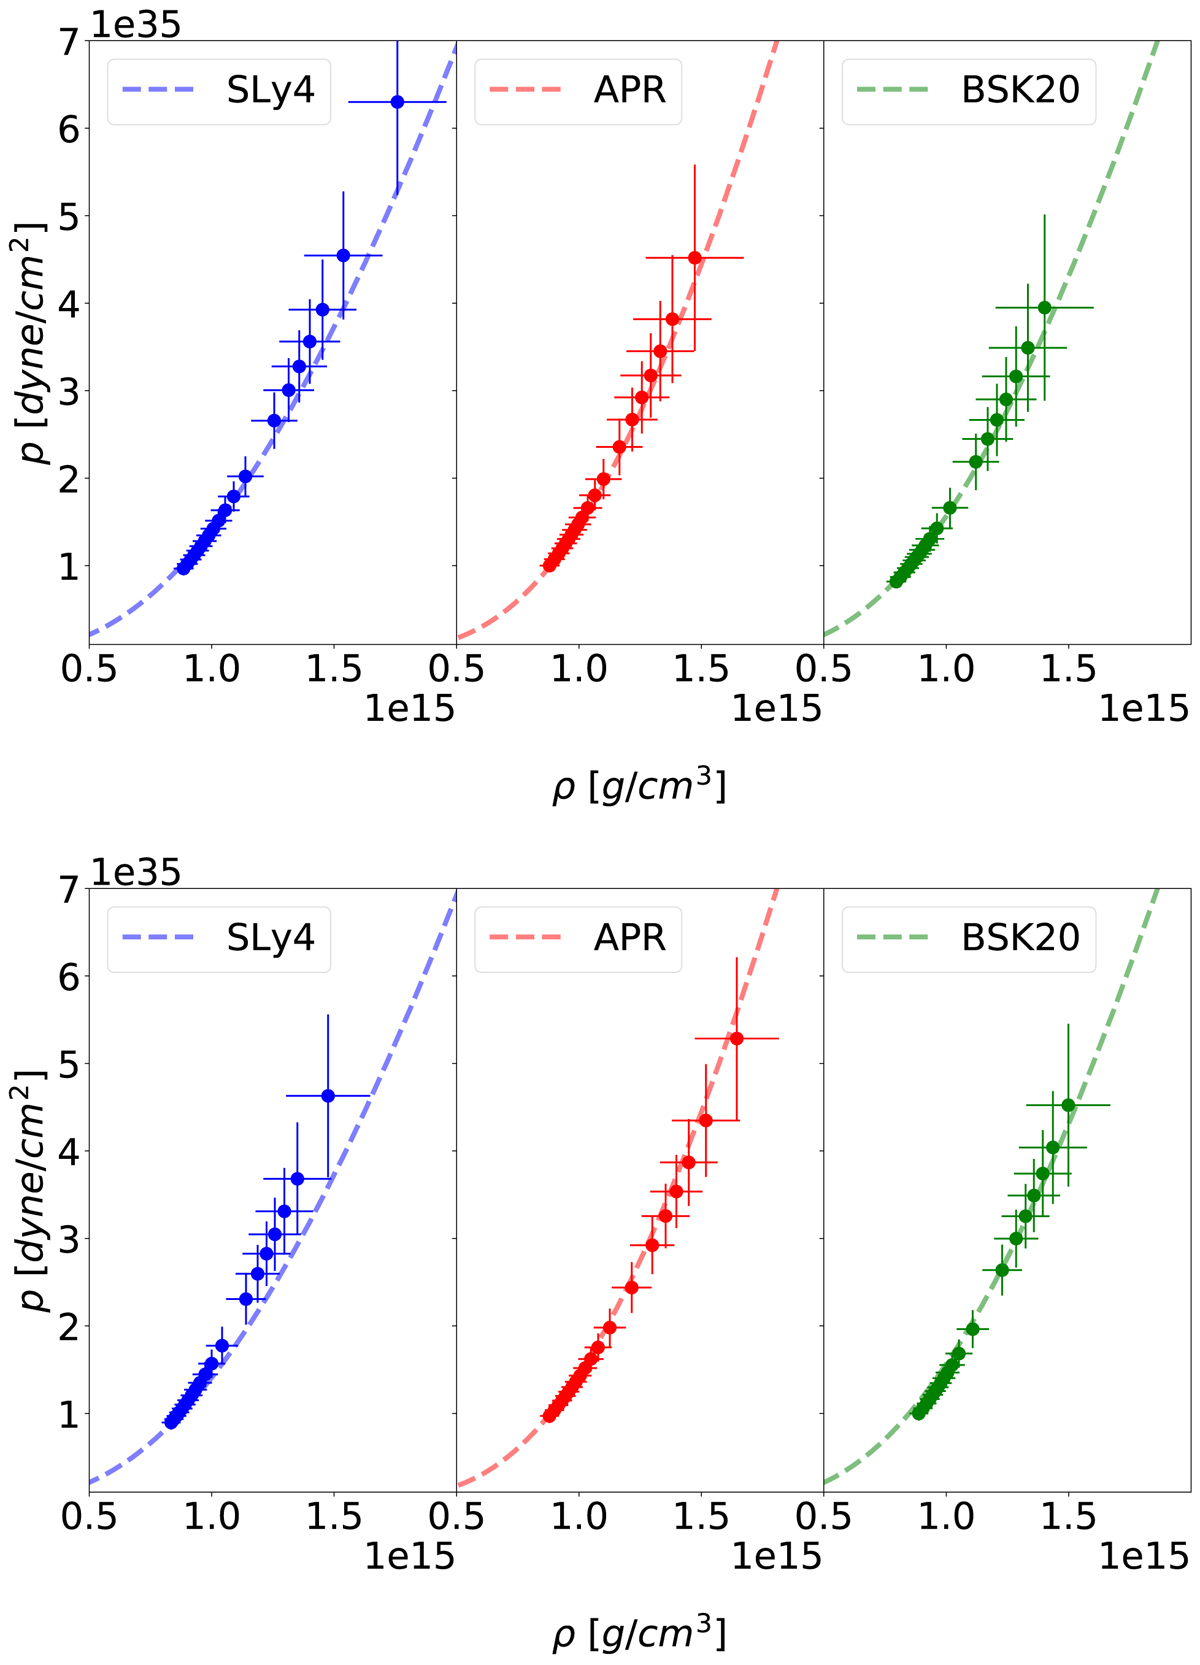
Top panels: ANN-reconstructed EOS from the M(R) data for the SLy4 EOS model (left plot), the APR EOS model (middle plot) and the BSK20 EOS model (right plot). Results are computed for the input M(R) data consisting of 20 observations with measurement uncertainties equal to merr = 0.1 M⊙, r̂err = 1 km. Bottom panels: ANN-reconstructed EOS from the M(R̂) data for the same EOS as in the top panels. Results for the input M(R̂) data consisting of 20 observations with measurement uncertainties equal to merr = 0.1 M⊙, r̂err = 1 km. Dashed lines correspond to the exact EOS relations.
Current usage metrics show cumulative count of Article Views (full-text article views including HTML views, PDF and ePub downloads, according to the available data) and Abstracts Views on Vision4Press platform.
Data correspond to usage on the plateform after 2015. The current usage metrics is available 48-96 hours after online publication and is updated daily on week days.
Initial download of the metrics may take a while.