Fig. 3.
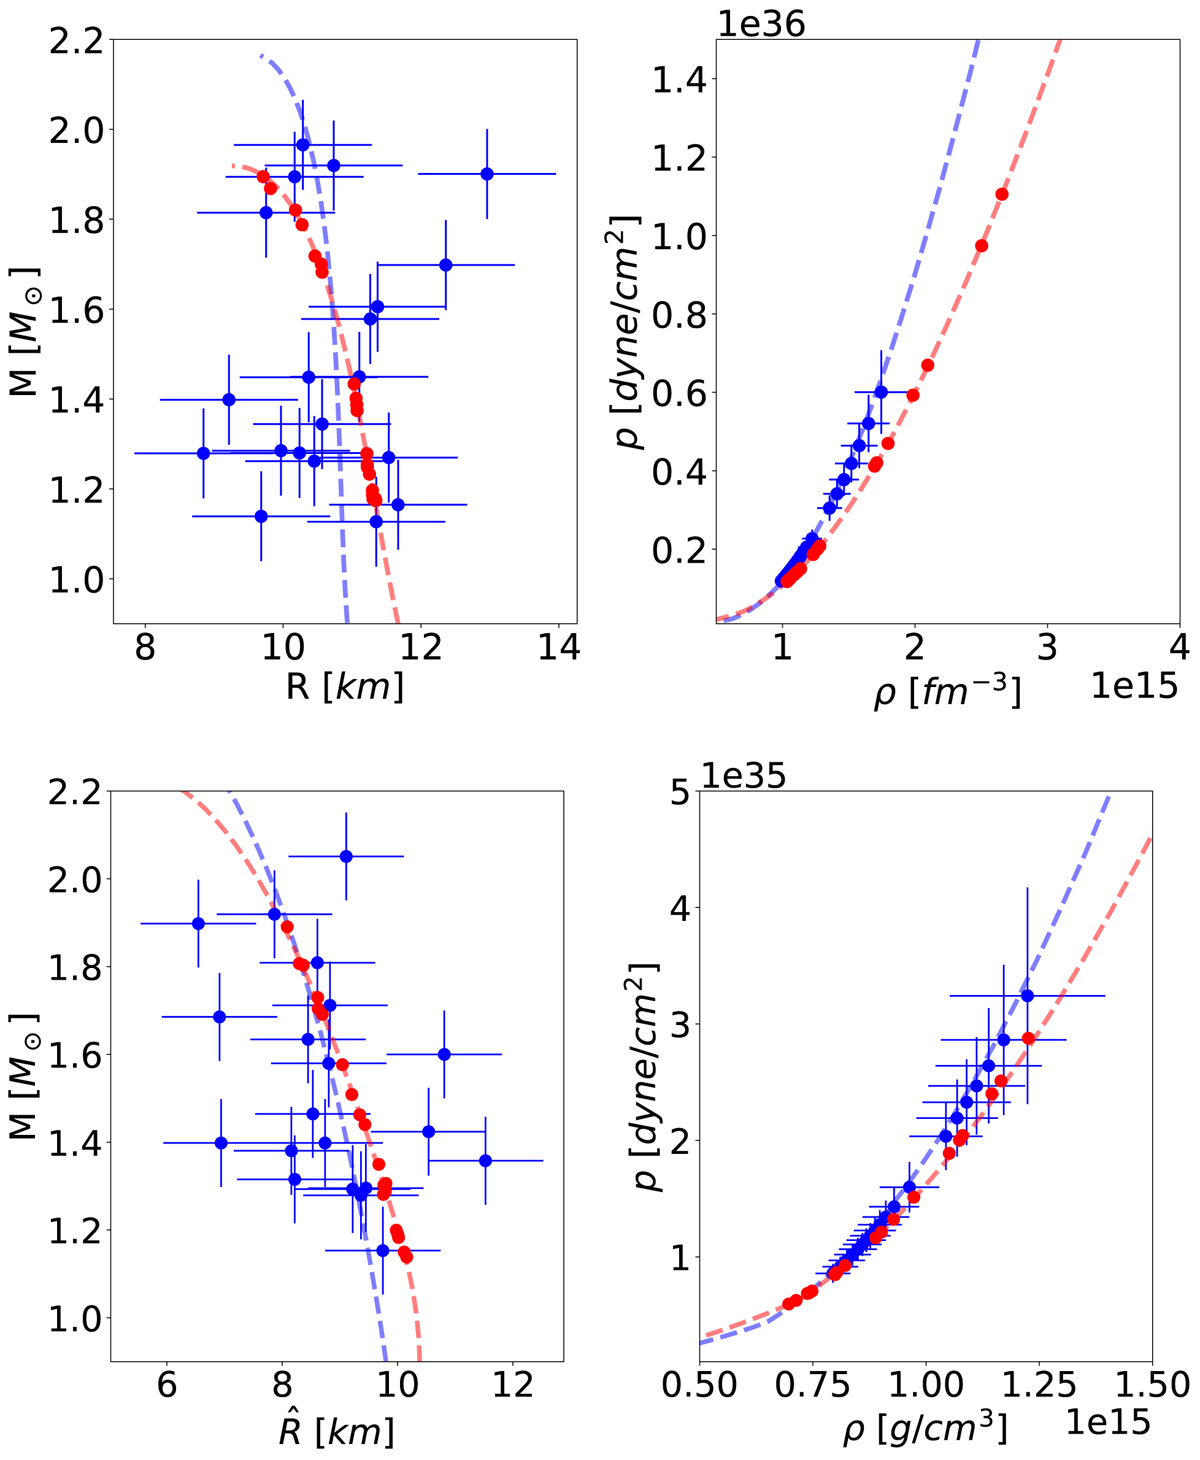
Top panels: example of the input data (M(R) measurements with errors, left plot), and corresponding output data from ANN (p(ρ) relation, right plot) for the estimation of EOS from M(R). Both input samples consist of 20 observations with masses randomly selected from a mass distribution (Sect. 3.2) and measurement uncertainties equal to σM = 0.1 M⊙, σR = 1 km (blue sample), σM = 0.01 M⊙, σR = 0.01 km (red sample). For the description of the uncertainties on the output, see the text. Bottom panels: example of the input data (M(R̂) measurements with errors, left plot), and corresponding output data from ANN (p(ρ) relation, right plot) for the estimation of EOS from M(R̂). Both input samples consist of 20 observations with masses randomly selected from a mass distribution (Sect. 3.2) and measurement uncertainties equal to σM = 0.1 M⊙, σR = 1 km (blue sample), σM = 0.01 M⊙, σR̂ = 0.01 km (red sample). Dashed curves correspond to original (ground-truth, error-free) sequences of input and output of the TOV equations. Presented examples correspond to different EOSs.
Current usage metrics show cumulative count of Article Views (full-text article views including HTML views, PDF and ePub downloads, according to the available data) and Abstracts Views on Vision4Press platform.
Data correspond to usage on the plateform after 2015. The current usage metrics is available 48-96 hours after online publication and is updated daily on week days.
Initial download of the metrics may take a while.