Fig. 1.
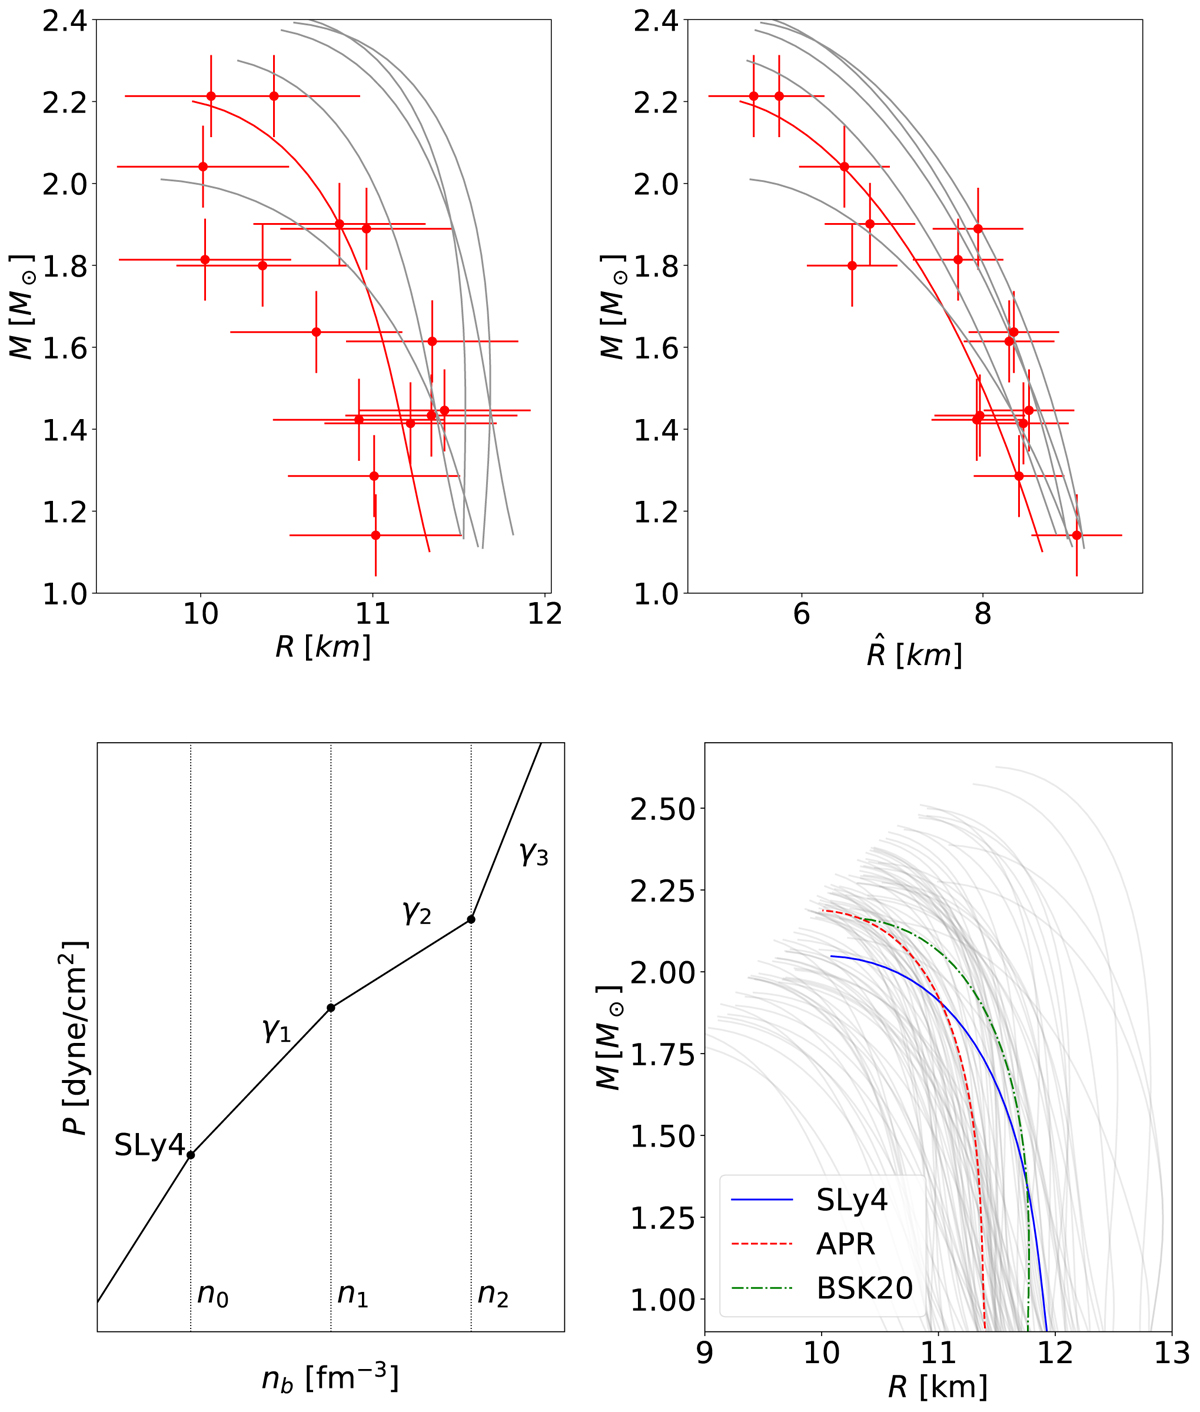
Top panels: left – sample M(R) relations; right – corresponding M(R̂) relations. Red curve and corresponding observations: example of a training datum, consisting on 20 points from the M(R) and M(R̂), selected assuming random normal distribution with the mean value equal to true values and standard deviations σM = 0.1 M⊙, σR = 1.0 km and σR̂ = 1.0 km. The configurations with the same M and R have, in general, different R̂. Bottom panels: left – schematic of a model EOS, composed in the low-density part from the realistic crust of the SLy4 EOS (Haensel & Pichon 1994; Douchin & Haensel 2001) and piecewise relativistic polytropes (Tooper 1965), right – mass-radius M(R) relations generated using the piecewise relativistic polytrope model (thin solid grey curves) and astrophysical models of NS sequences, based on the following EOSs: the SLy4 EOS (solid blue curve), the APR EOS (dashed red curve) and the BSK20 EOS (dash-dotted green curve).
Current usage metrics show cumulative count of Article Views (full-text article views including HTML views, PDF and ePub downloads, according to the available data) and Abstracts Views on Vision4Press platform.
Data correspond to usage on the plateform after 2015. The current usage metrics is available 48-96 hours after online publication and is updated daily on week days.
Initial download of the metrics may take a while.