Fig. C.1
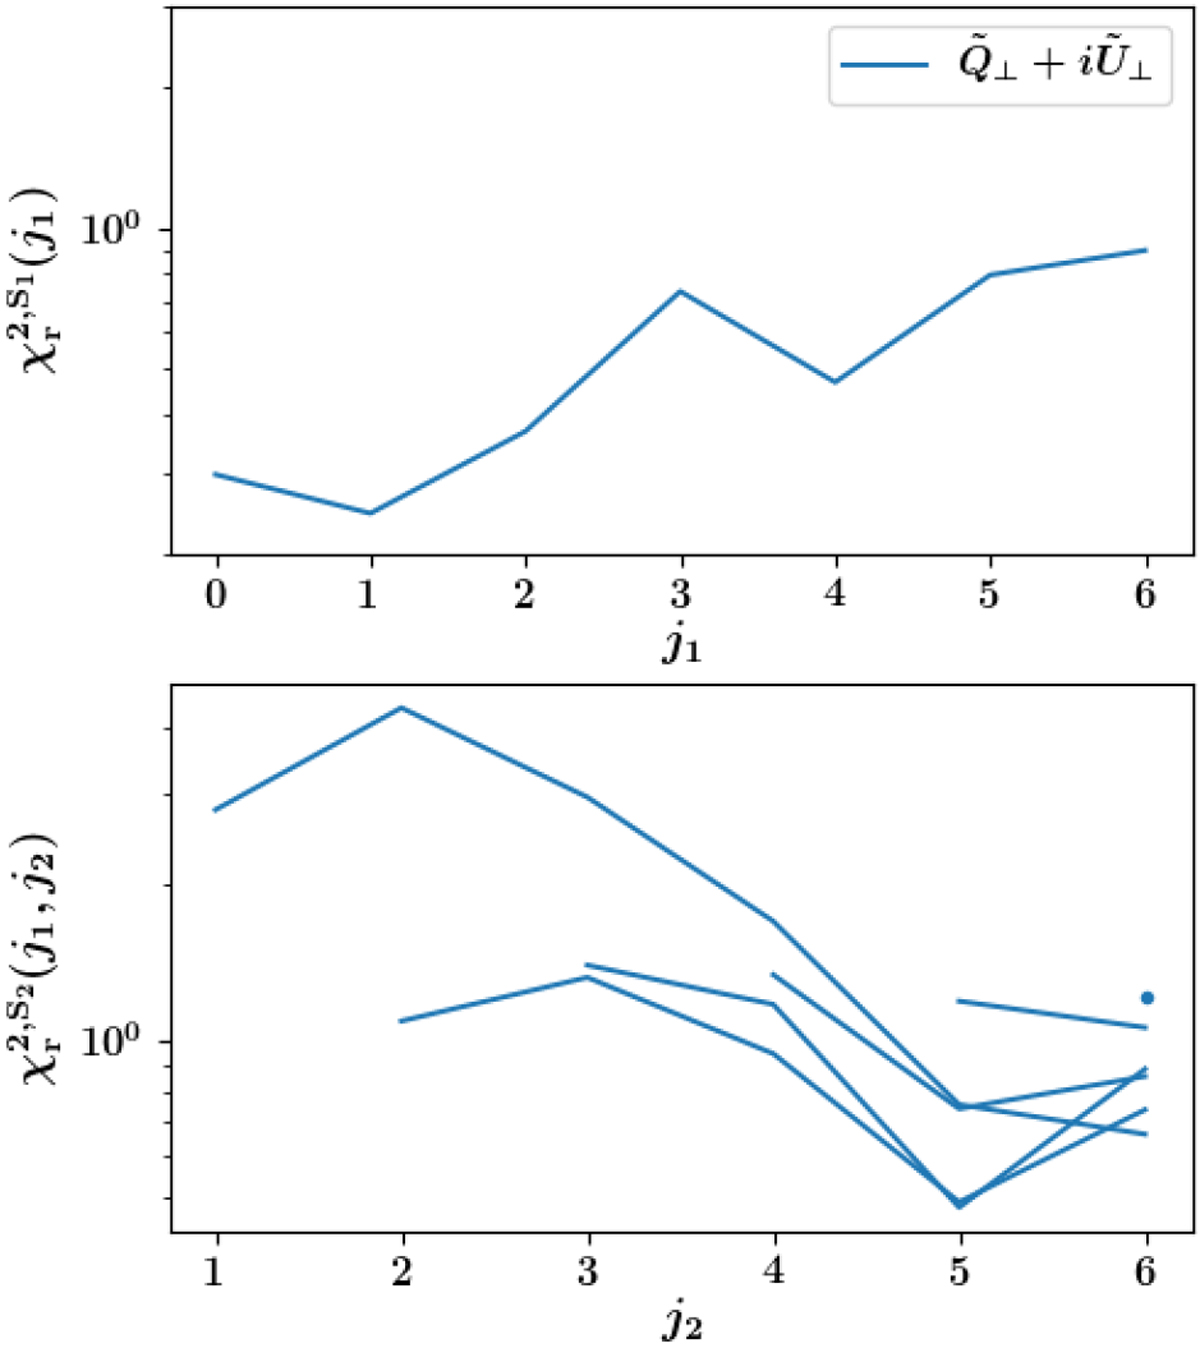
Reduced chi square ![]() (top) and
(top) and ![]() (bottom)associated with the RWST fits of the WST coefficients that take into account lattice terms (see Eqs. (C.1) and (C.2)) for the
(bottom)associated with the RWST fits of the WST coefficients that take into account lattice terms (see Eqs. (C.1) and (C.2)) for the
![]() data set. Each curve in the
data set. Each curve in the ![]() plot corresponds to a fixed j1
value while j2
ranges from j1 + 1 to J − 1 = 6. For j1 = J − 2, the curve is reduced to a single dot on the figure. We use logarithmic scales for better visibility.
plot corresponds to a fixed j1
value while j2
ranges from j1 + 1 to J − 1 = 6. For j1 = J − 2, the curve is reduced to a single dot on the figure. We use logarithmic scales for better visibility.
Current usage metrics show cumulative count of Article Views (full-text article views including HTML views, PDF and ePub downloads, according to the available data) and Abstracts Views on Vision4Press platform.
Data correspond to usage on the plateform after 2015. The current usage metrics is available 48-96 hours after online publication and is updated daily on week days.
Initial download of the metrics may take a while.