Fig. 2.
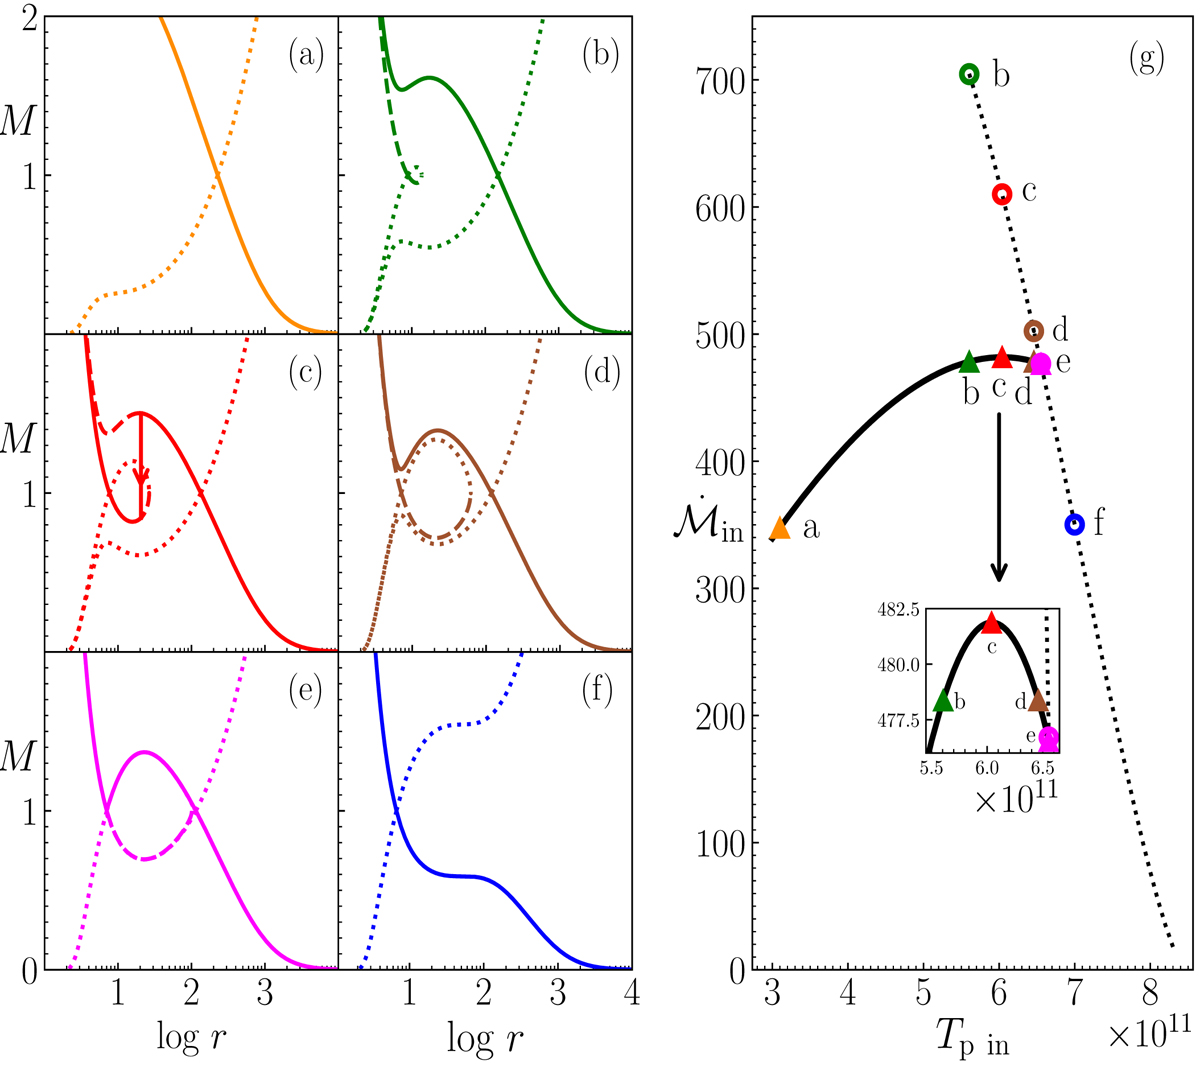
Left: M vs log r plot for various values of Tpin. (a) Tpin = 3.1 × 10¹¹ K, (b) Tpin = 5.605 × 10¹¹K, (c) Tpin = 6.04 × 10¹¹ K, (d) Tpin = 6.460 × 10¹¹ K, (e) Tpin = 6.554 × 10¹¹ K and (f) Tpin = 7.0 × 10¹¹ K. Global solutions are represented by solid lines. Panel g: ![]() vs Tpin. Solid black curve is for the solutions passing through outer sonic point, while dotted black curve is for solutions passing through inner sonic point. Panels a–f: solutions corresponding to the points marked in right panel g. The disc flow parameters are E = 1.0015, λ = 2.6 and Ṁ = 0.02 ṀEdd. The space-time is described by a BH of mass 10 M⊙.
vs Tpin. Solid black curve is for the solutions passing through outer sonic point, while dotted black curve is for solutions passing through inner sonic point. Panels a–f: solutions corresponding to the points marked in right panel g. The disc flow parameters are E = 1.0015, λ = 2.6 and Ṁ = 0.02 ṀEdd. The space-time is described by a BH of mass 10 M⊙.
Current usage metrics show cumulative count of Article Views (full-text article views including HTML views, PDF and ePub downloads, according to the available data) and Abstracts Views on Vision4Press platform.
Data correspond to usage on the plateform after 2015. The current usage metrics is available 48-96 hours after online publication and is updated daily on week days.
Initial download of the metrics may take a while.