Fig. C.1.
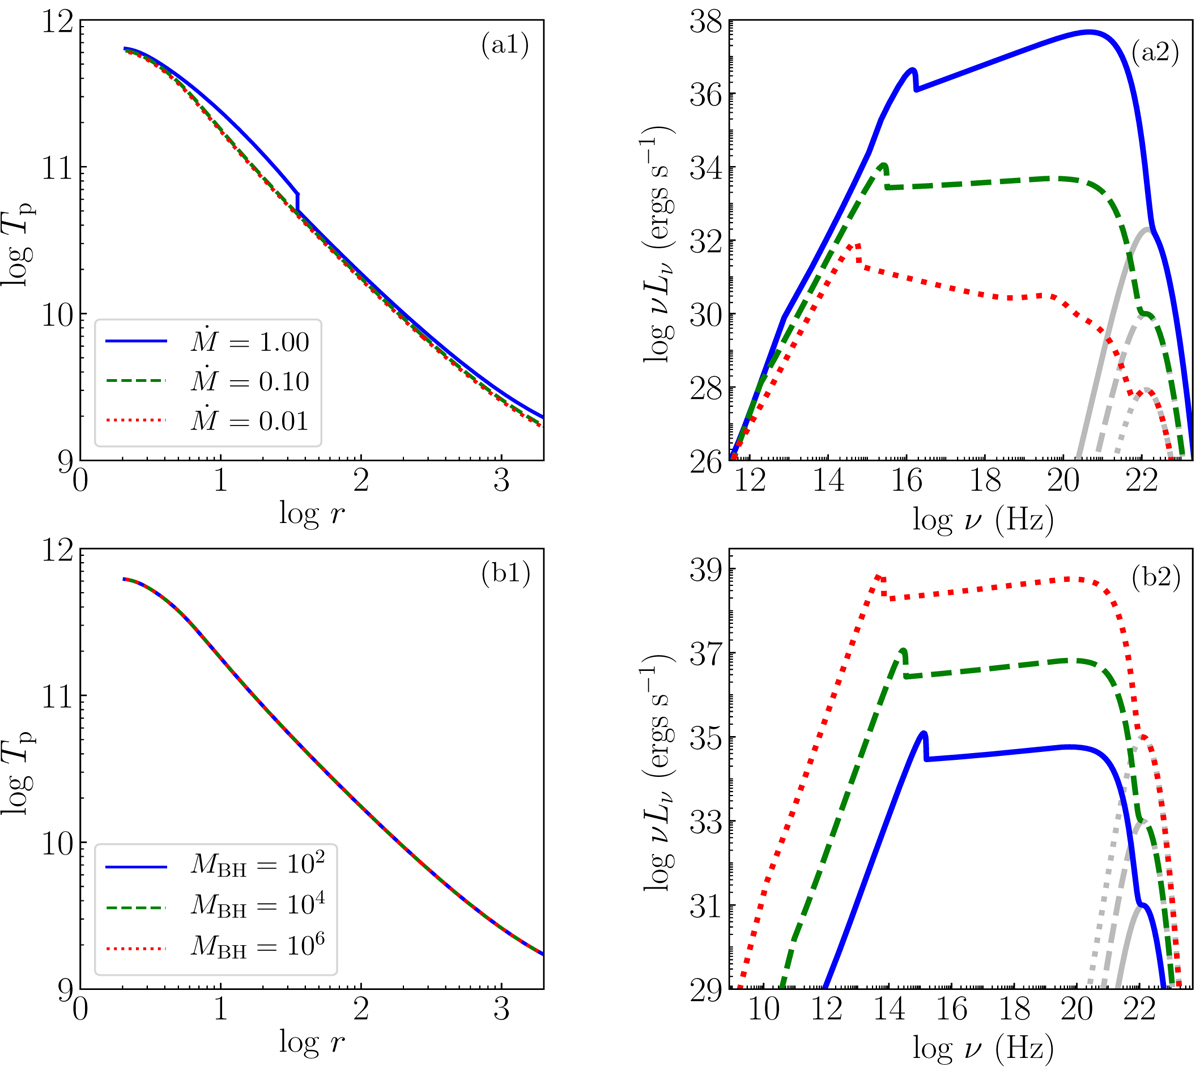
a1, a2: dependence on the accretion rate, Ṁ = 0.01 (red, dotted), 0.1 (green, dashed), and 1.0 (blue, solid). (a1) log Tp as a function of log r and (a2) log νLν with log ν. (b1, b2) Dependence on mass of BH, MBH = 102 (blue, solid), 104 (green, dashed), 106 (red, dotted) in the production of γ rays. (b1) log Tp as a function of log r and in (b2) the corresponding spectra are plotted. The gamma ray emission is presented in grey.
Current usage metrics show cumulative count of Article Views (full-text article views including HTML views, PDF and ePub downloads, according to the available data) and Abstracts Views on Vision4Press platform.
Data correspond to usage on the plateform after 2015. The current usage metrics is available 48-96 hours after online publication and is updated daily on week days.
Initial download of the metrics may take a while.