Fig. 14.
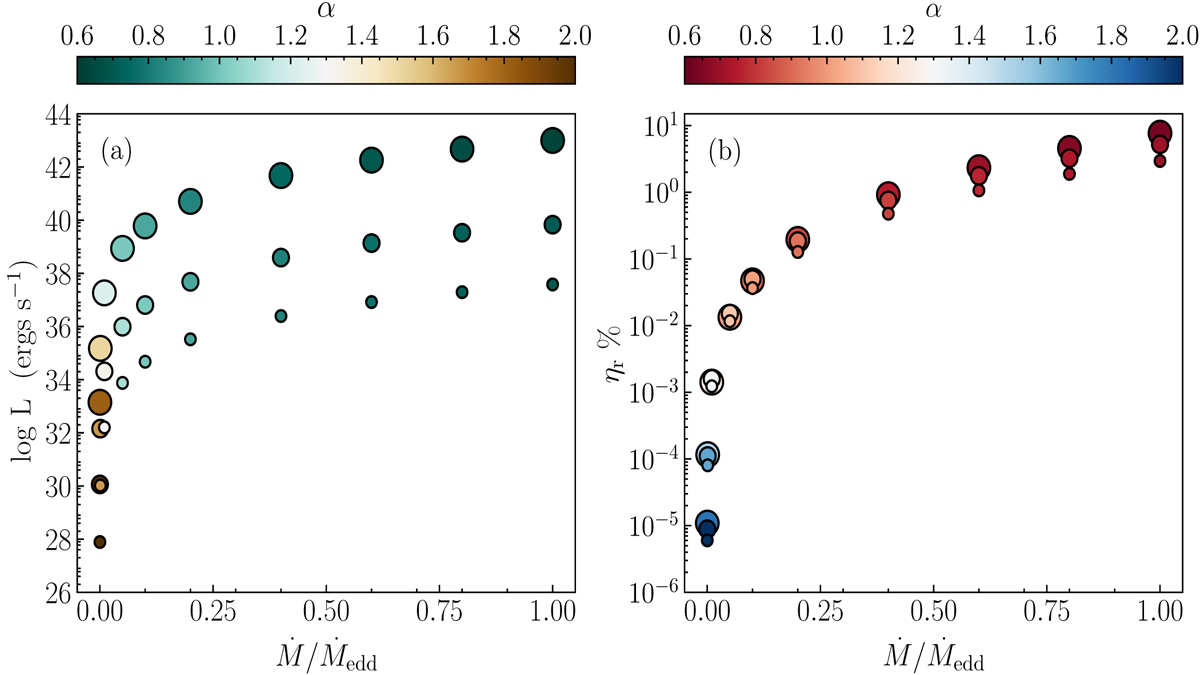
(a) Variation of bolometric luminosity (in ergs s−1) and (b) efficiency (in %) as a function of Ṁ (in units of Eddington rate, Ṁedd). Colour bar indicates the spectral index (α). The BHs of different masses: 10 M⊙ (small circle), 103 M⊙ (medium circle), and 106 M⊙ (largest circle) are represented with increasing sizes of the circles. The parameters used here are E = 1.001 and λ = 2.4.
Current usage metrics show cumulative count of Article Views (full-text article views including HTML views, PDF and ePub downloads, according to the available data) and Abstracts Views on Vision4Press platform.
Data correspond to usage on the plateform after 2015. The current usage metrics is available 48-96 hours after online publication and is updated daily on week days.
Initial download of the metrics may take a while.