Fig. 1.
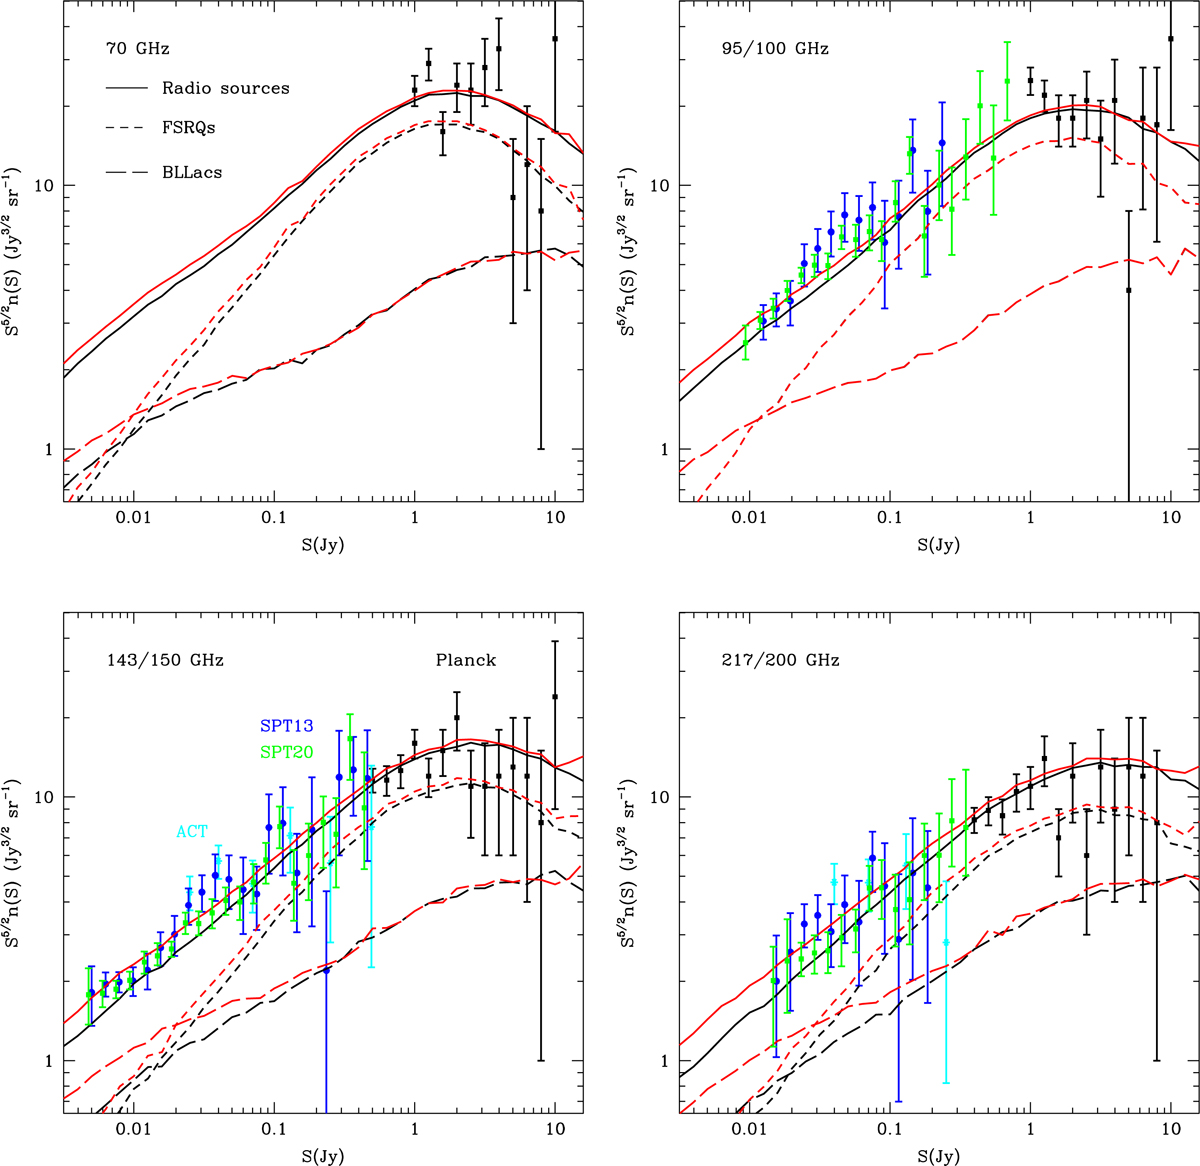
Normalized differential number counts (S5/2n(S)) from the Tucci et al. (2011) model (black lines) and observations (Planck, black points; ACT, cyan points; SPT, blue and green points) between 70 and 220 GHz. Red lines represent the model, but with the updated parameter values as described in the text. The very recent measurements from ACT at 148 GHz (cyan dots from Datta et al. 2019) and from SPT-SZ (green dots from Everett et al. 2020) are not used in the fit, but are shown for comparison.
Current usage metrics show cumulative count of Article Views (full-text article views including HTML views, PDF and ePub downloads, according to the available data) and Abstracts Views on Vision4Press platform.
Data correspond to usage on the plateform after 2015. The current usage metrics is available 48-96 hours after online publication and is updated daily on week days.
Initial download of the metrics may take a while.