Fig. 6
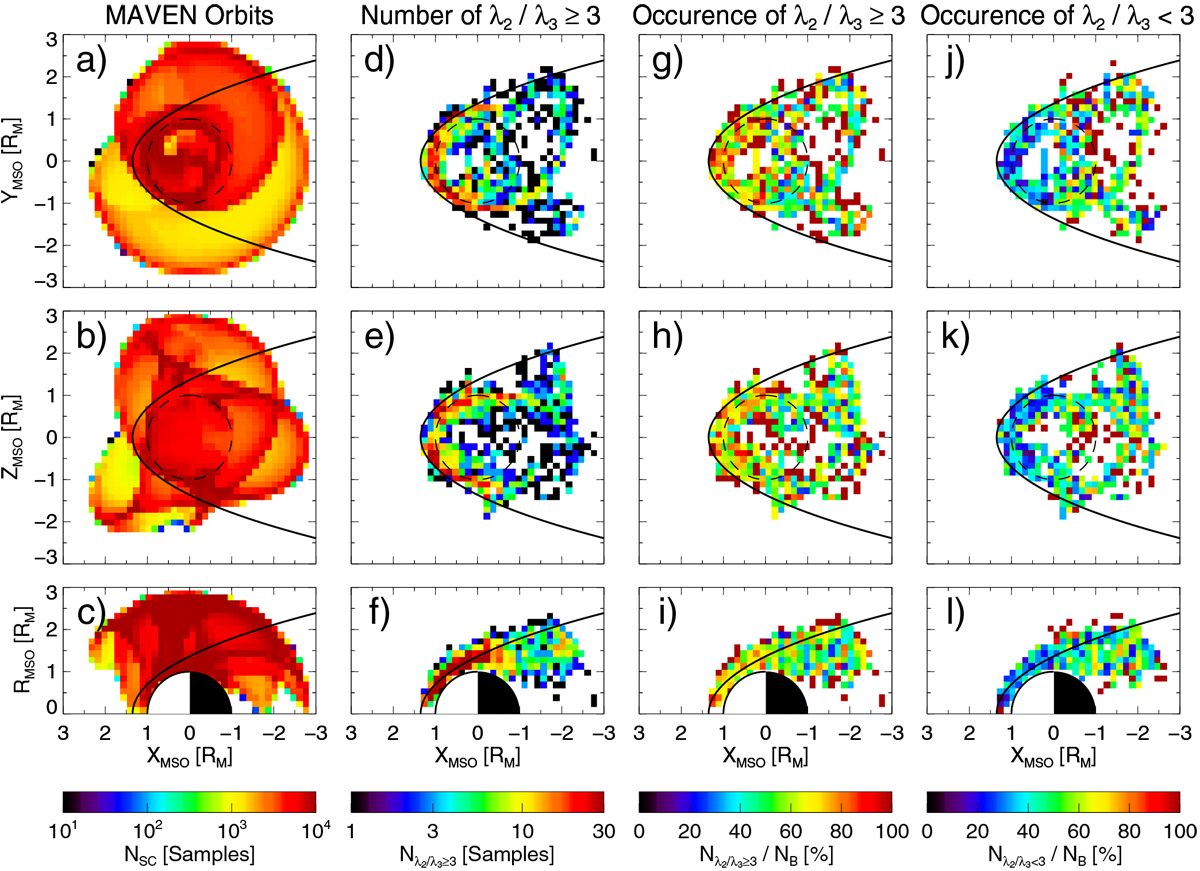
Global distributions of MAVEN orbits used in this study. (a–c) Total orbits (Nsc). (d–f) Crossings of discontinuities between the magnetosheath and Martian induced magnetosheath with λ2 ∕λ3 ≥ 3 (![]() ). (g–i) Ratio of
). (g–i) Ratio of ![]() to the total crossings (NB). (j-l) Ratio of
to the total crossings (NB). (j-l) Ratio of ![]() to the total crossings. The distributions from top to bottom are in X–Y,
X–Z, and X–R
planes in the MSO coordinates, respectively. The black dashed circles stand for Mars. The black solid curves stand for the MPB from Trotignon’s model (Trotignon et al. 2006).
to the total crossings. The distributions from top to bottom are in X–Y,
X–Z, and X–R
planes in the MSO coordinates, respectively. The black dashed circles stand for Mars. The black solid curves stand for the MPB from Trotignon’s model (Trotignon et al. 2006).
Current usage metrics show cumulative count of Article Views (full-text article views including HTML views, PDF and ePub downloads, according to the available data) and Abstracts Views on Vision4Press platform.
Data correspond to usage on the plateform after 2015. The current usage metrics is available 48-96 hours after online publication and is updated daily on week days.
Initial download of the metrics may take a while.