Fig. 2
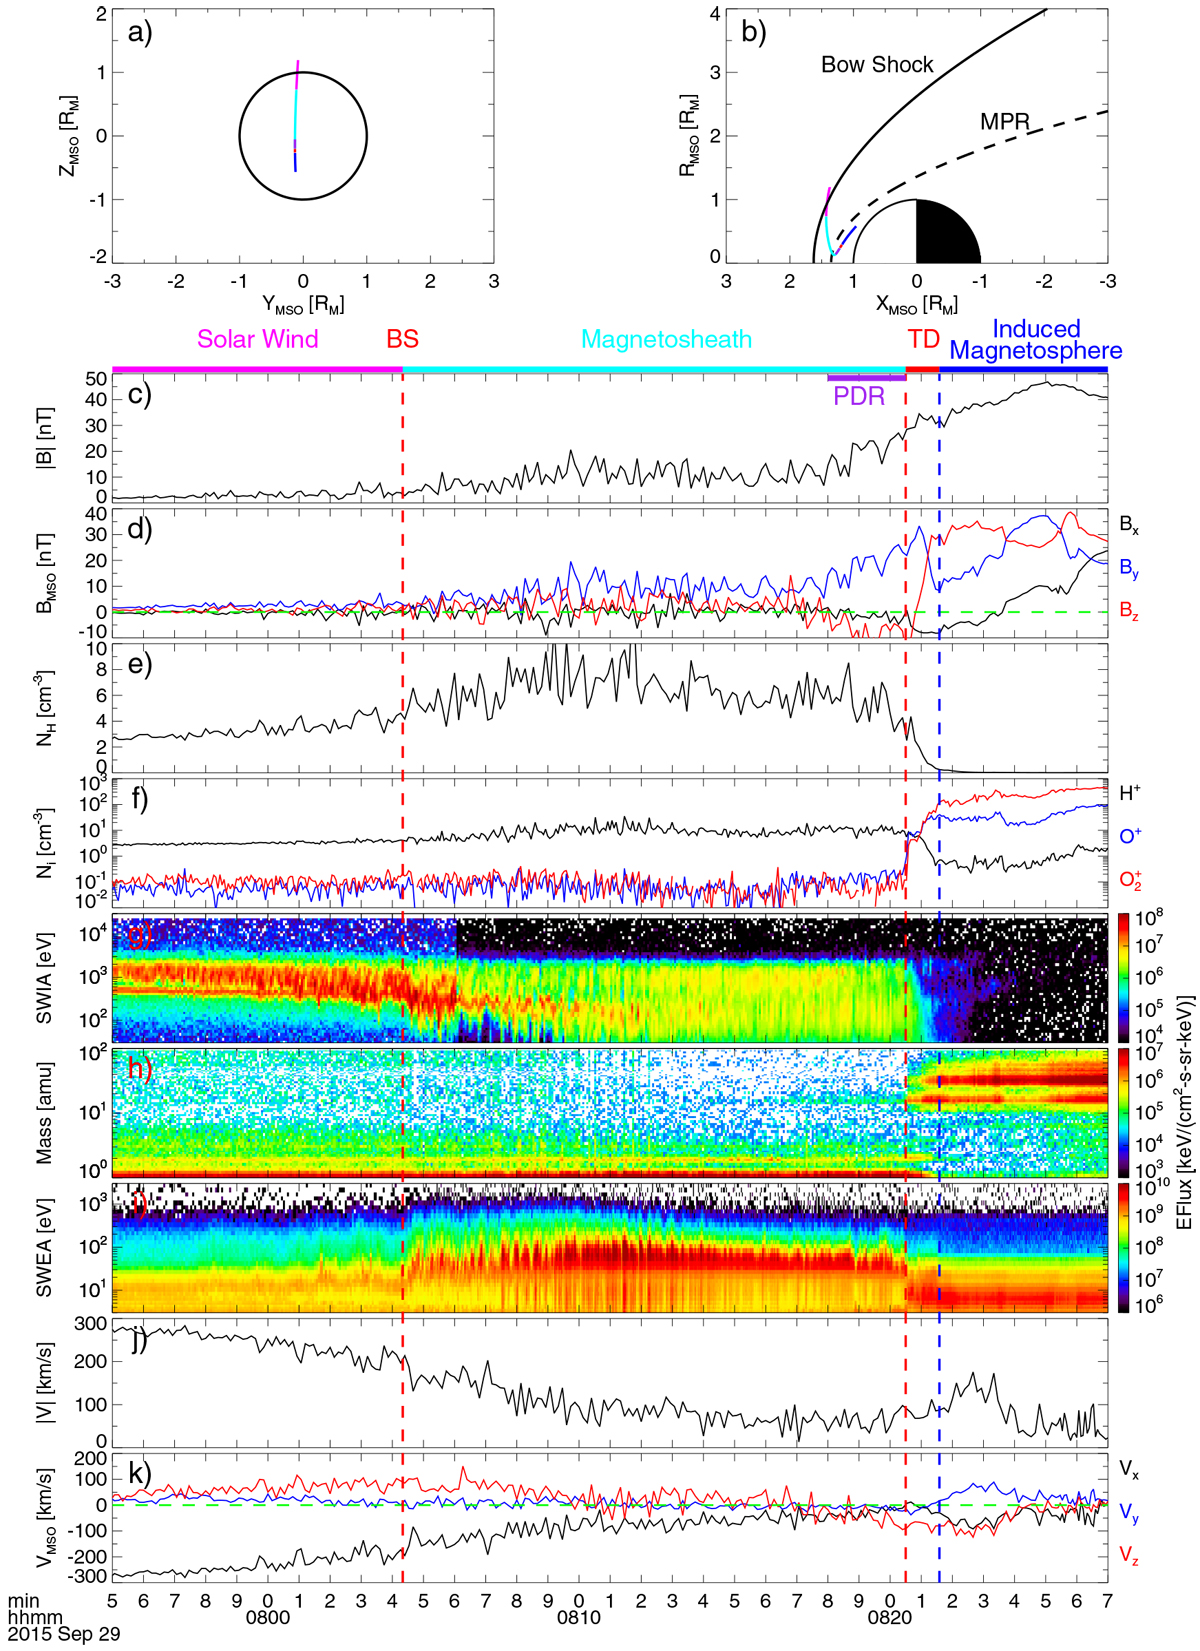
Overview of the selected MAVEN observations from solar wind to Martian induced magnetosphere near the subsolar point on 29 September 2015. The MAVEN orbits in (a) Y –Z and (b) X–R planes in theMSO coordinates, where ![]() . (c) Magnetic field magnitude. (d) Three-component magnetic field in the MSO coordinate system. (e) Number density of protons from SWIA. (f) Ion components from STATIC. (g) Spectrum of the solar wind protons from SWIA. (h) Mass spectrum of ion components from STATIC. (i) Spectrum of electrons from SWEA. (j) Speed and (k) velocity of protons from SWIA in MSO coordinates. The colour-coded curves in (a) and (b) correspond to the orbits during the time interval marked by the horizontal colour bars at the top of panel c. The black solid curves and black dashed curves are the BS and MPB calculated from Trotignon et al. (2006). The vertical dashed linesand the horizontal colour bars stand for the passes of the boundaries in different regions: solar wind, BS, magnetosheath (containing the PDR), TD, and induced magnetosphere. The black arrows in panels c and e track the variations of the magnetic field magnitude and proton number density in the magnetosheath (containing the PDR).
. (c) Magnetic field magnitude. (d) Three-component magnetic field in the MSO coordinate system. (e) Number density of protons from SWIA. (f) Ion components from STATIC. (g) Spectrum of the solar wind protons from SWIA. (h) Mass spectrum of ion components from STATIC. (i) Spectrum of electrons from SWEA. (j) Speed and (k) velocity of protons from SWIA in MSO coordinates. The colour-coded curves in (a) and (b) correspond to the orbits during the time interval marked by the horizontal colour bars at the top of panel c. The black solid curves and black dashed curves are the BS and MPB calculated from Trotignon et al. (2006). The vertical dashed linesand the horizontal colour bars stand for the passes of the boundaries in different regions: solar wind, BS, magnetosheath (containing the PDR), TD, and induced magnetosphere. The black arrows in panels c and e track the variations of the magnetic field magnitude and proton number density in the magnetosheath (containing the PDR).
Current usage metrics show cumulative count of Article Views (full-text article views including HTML views, PDF and ePub downloads, according to the available data) and Abstracts Views on Vision4Press platform.
Data correspond to usage on the plateform after 2015. The current usage metrics is available 48-96 hours after online publication and is updated daily on week days.
Initial download of the metrics may take a while.