Fig. 15
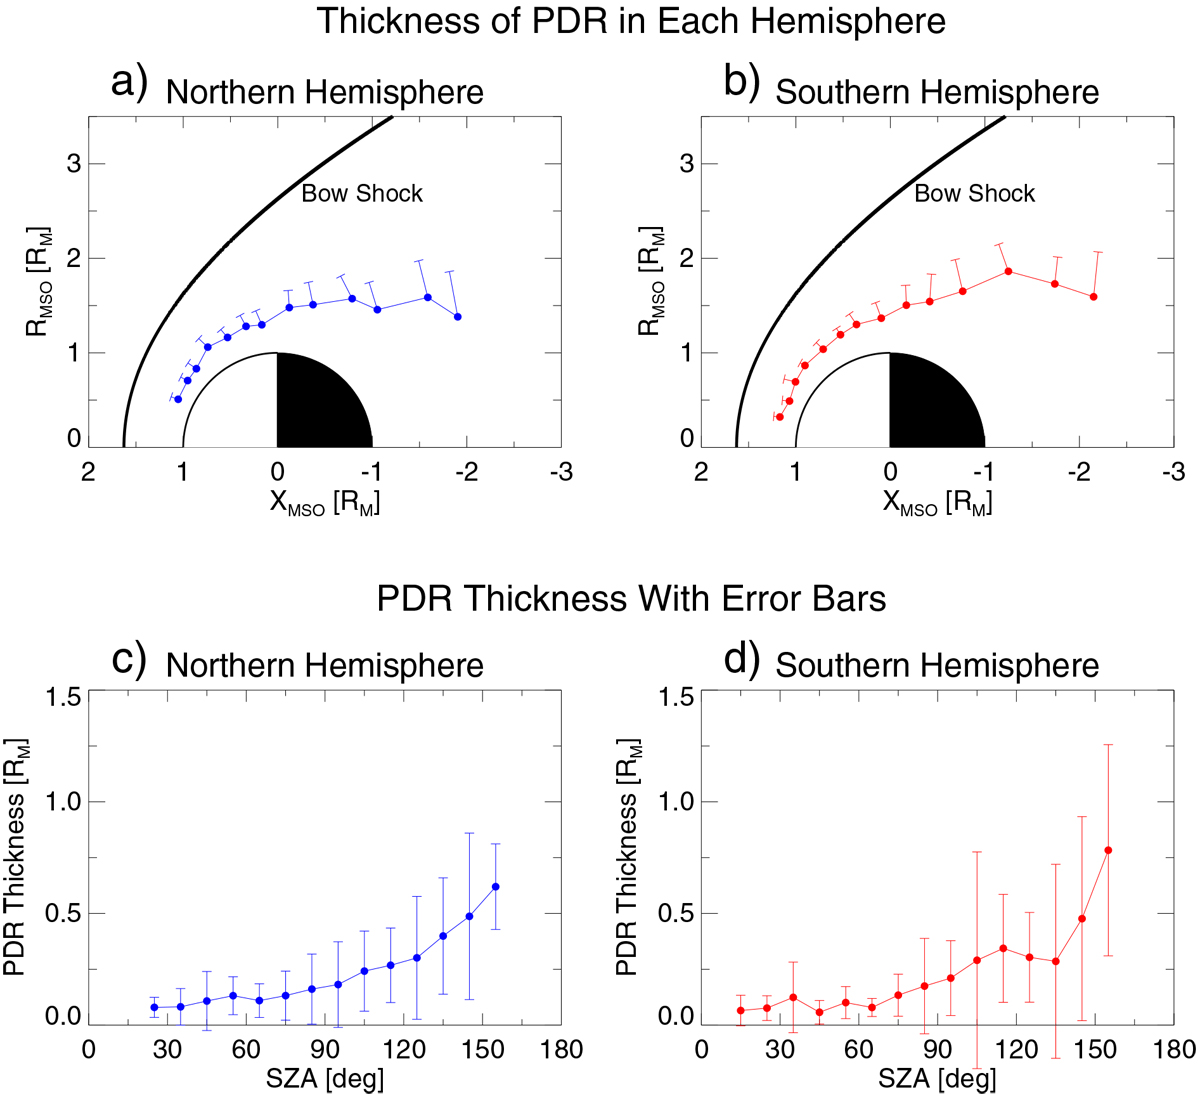
Average thicknesses of the PDR upstream of the TD (|BN∕B0|≤ 0.1) (a–b) in MSO coordinates, where ![]() , and (c–d) with error bars depending on SZA. The blue and red bars show the mean values of PDR thickness at every 10° of solar zenith angle (SZA) in the (a) northern and (b) southern hemisphere, respectively. The direction of the PDR bar is perpendicular to the mean local TD plane, and the dots are the average location of the inner boundary of the PDR, i.e. TDs as shown in Figs. 9a–c.
, and (c–d) with error bars depending on SZA. The blue and red bars show the mean values of PDR thickness at every 10° of solar zenith angle (SZA) in the (a) northern and (b) southern hemisphere, respectively. The direction of the PDR bar is perpendicular to the mean local TD plane, and the dots are the average location of the inner boundary of the PDR, i.e. TDs as shown in Figs. 9a–c.
Current usage metrics show cumulative count of Article Views (full-text article views including HTML views, PDF and ePub downloads, according to the available data) and Abstracts Views on Vision4Press platform.
Data correspond to usage on the plateform after 2015. The current usage metrics is available 48-96 hours after online publication and is updated daily on week days.
Initial download of the metrics may take a while.