Fig. 1
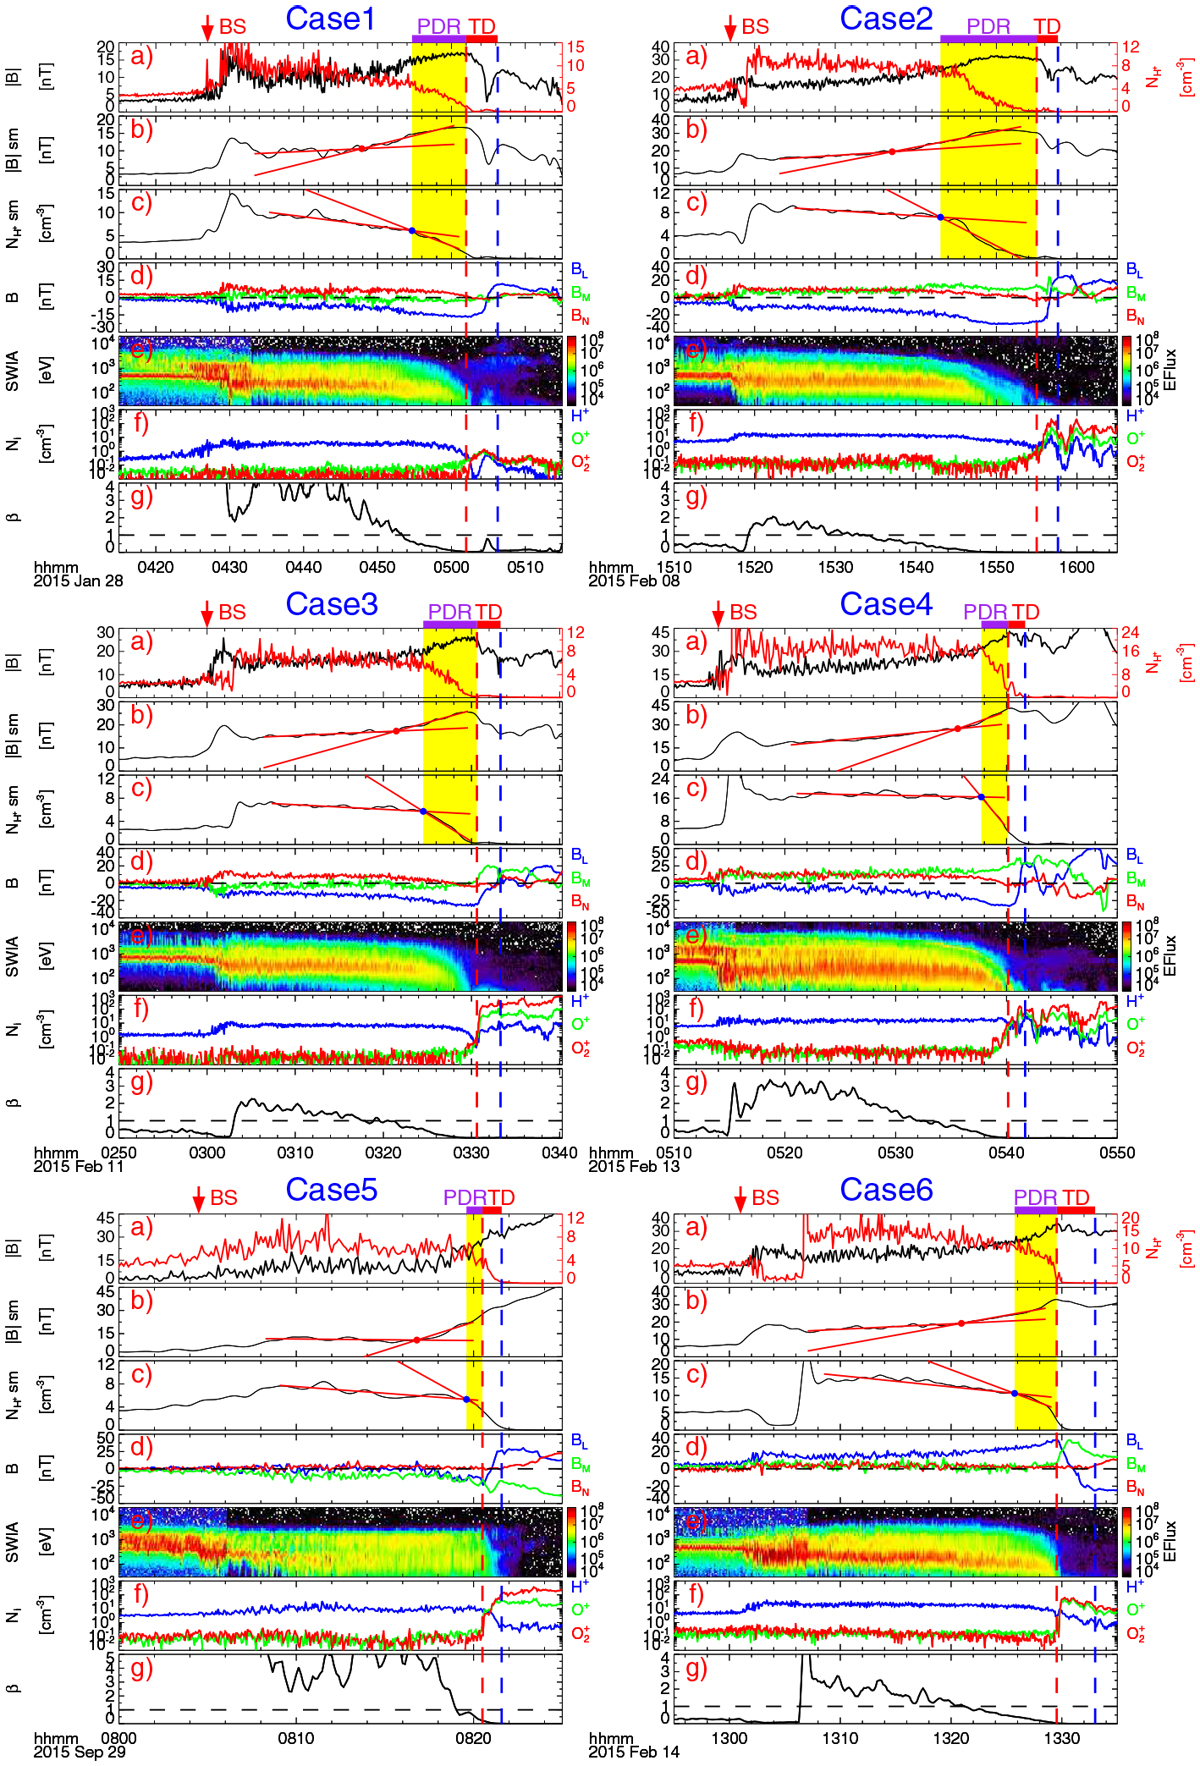
MAVEN measurements of six inbound crossings, including Case A and Case B in Sects. 3.2 and 3.3, to show the features used to identify the PDR. The panels, from top to bottom, in each event are (a) the measurements and (b–c) the smoothed data of the magnetic field strength from MAG instrument (in black) and proton number density from SWIA (in red in panel a), (d) the three-component magnetic field in LMN coordinates, (e) the spectrum of the protons from SWIA, (f) the ion densities from STATIC instrument, and (g) the value of plasma beta (β, the ratio of thermal pressure to magnetic pressure). For each event, the red arrow labelled “BS” marks the position of the bow shock, and the horizontal colour bars stand for the PDR (in purple) and TD (in red) bounded by the two verticaldashed lines. The red lines in panels b and c represent the linear fitting lines of the smoothed |B| and
![]() , respectively. The blue dots in panels c represent the leading edge of the PDR identifiedby the minimum variance derived from the linear fitting of the smoothed
, respectively. The blue dots in panels c represent the leading edge of the PDR identifiedby the minimum variance derived from the linear fitting of the smoothed
![]() .
.
Current usage metrics show cumulative count of Article Views (full-text article views including HTML views, PDF and ePub downloads, according to the available data) and Abstracts Views on Vision4Press platform.
Data correspond to usage on the plateform after 2015. The current usage metrics is available 48-96 hours after online publication and is updated daily on week days.
Initial download of the metrics may take a while.