Free Access
Fig. 42.
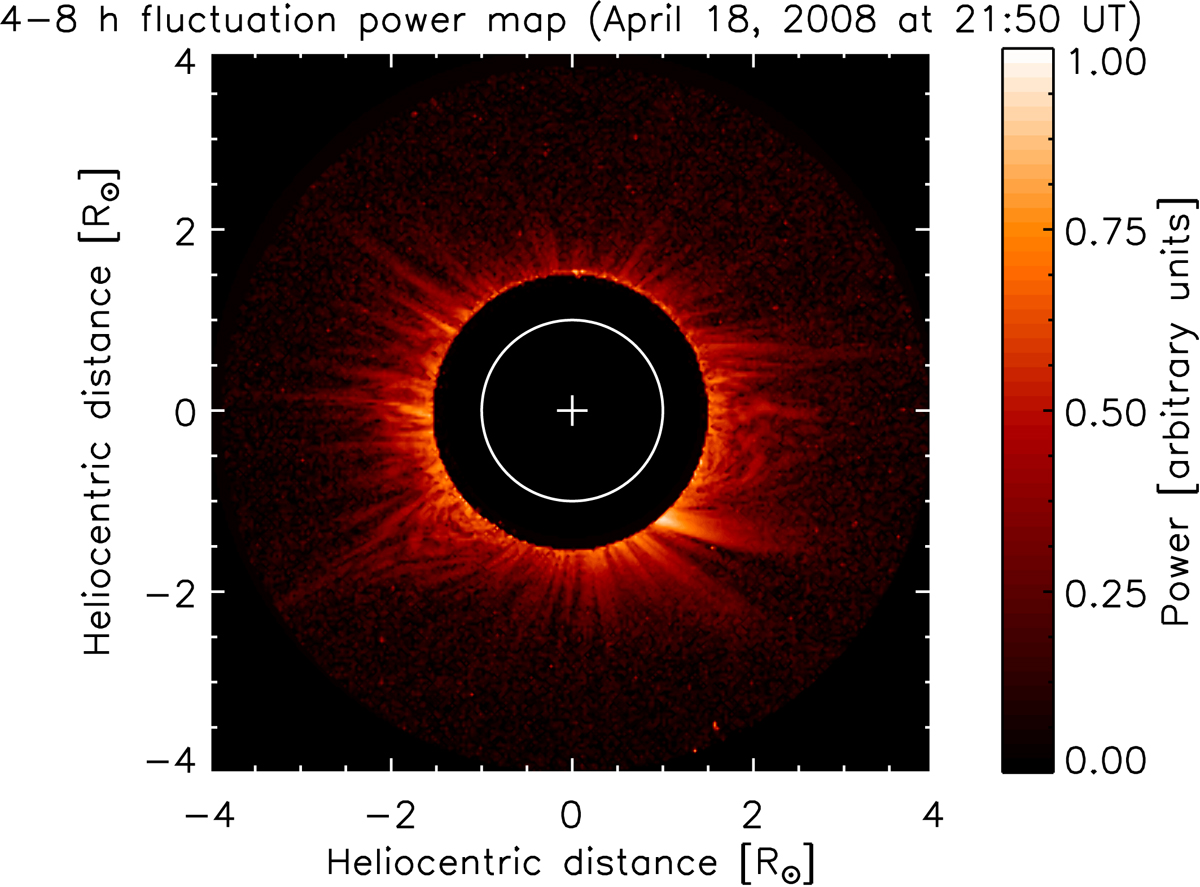
Two-dimensional map of the total brightness fluctuation power averaged over the 4–8 h timescale band on April 18, 2008, at 21:50 UT, inferred from the STEREO A COR-1 observations of the solar corona (Telloni et al. 2013). The continuous line indicates the solar disk.
Current usage metrics show cumulative count of Article Views (full-text article views including HTML views, PDF and ePub downloads, according to the available data) and Abstracts Views on Vision4Press platform.
Data correspond to usage on the plateform after 2015. The current usage metrics is available 48-96 hours after online publication and is updated daily on week days.
Initial download of the metrics may take a while.