Fig. 7.
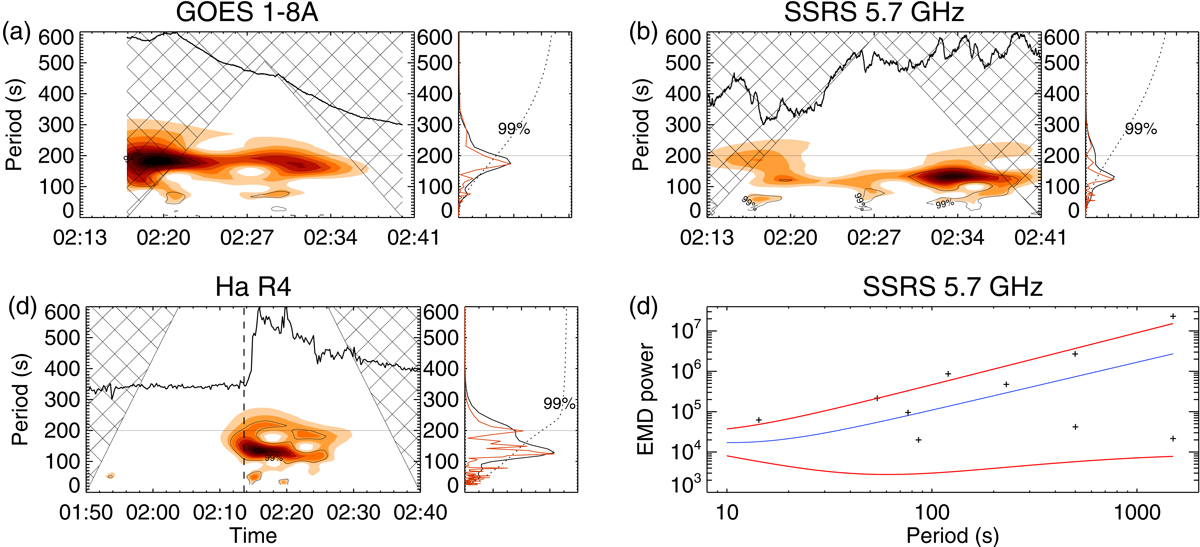
Panels a–c: results of the wavelet and Fourier analyses of the soft X-ray, microwave, and Hα R4 kernel data, during the decay flare phase. Panel d: empirical mode decomposition (EMD) spectrum of the microwave flux at 5.7 GHz. The total energies of the decomposed intrinsic modes are shown by crosses. The blue curve represents the global slope of the spectrum. The 99% confidence intervals are shown by red curves.
Current usage metrics show cumulative count of Article Views (full-text article views including HTML views, PDF and ePub downloads, according to the available data) and Abstracts Views on Vision4Press platform.
Data correspond to usage on the plateform after 2015. The current usage metrics is available 48-96 hours after online publication and is updated daily on week days.
Initial download of the metrics may take a while.