Fig. 4.
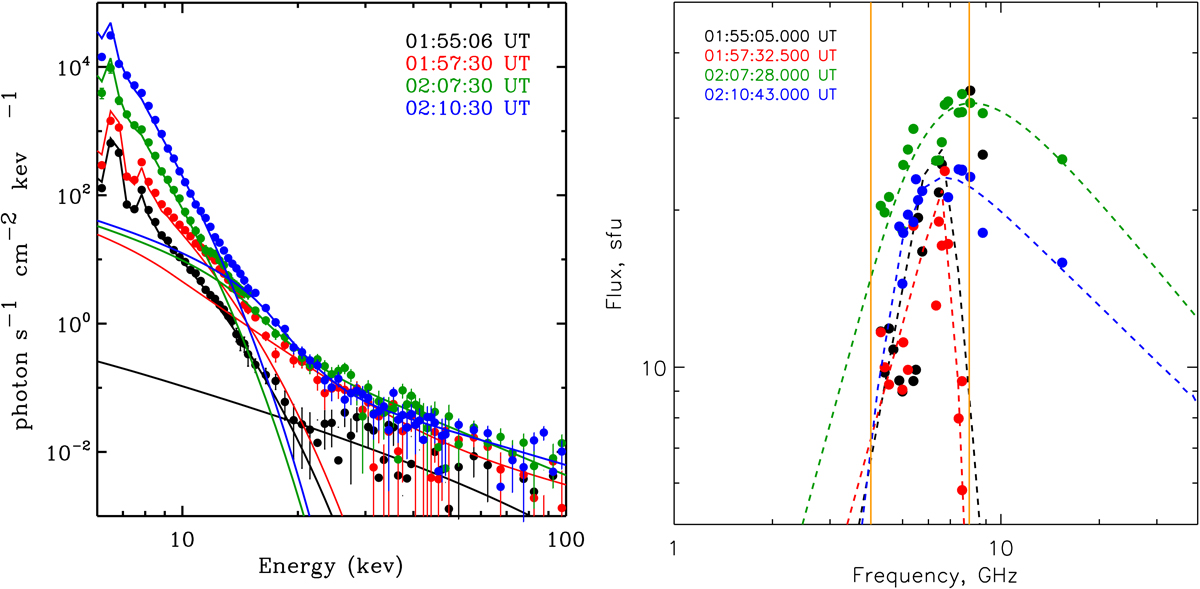
Left panel: evolution of the X-ray spectra. The observed X-ray spectra (marked by dots) are overplotted by the results of the fitting by a model consisting of an optically thin thermal bremsstrahlung function and power-law function. The average value of the time interval, the observational data, and the results of the fitting are marked by the same colour for each moment in time. Right panel: evolution of the microwave spectra. The observed data (marked by the dots) are over plotted by the result of fitting by the function corresponding to the form of the gyrosynchrotron spectrum. The average value of the time interval, the observational data and the results of the fitting are marked by the same colour for each moment in time. The vertical orange lines mark the 4 GHz and 8 GHz frequencies.
Current usage metrics show cumulative count of Article Views (full-text article views including HTML views, PDF and ePub downloads, according to the available data) and Abstracts Views on Vision4Press platform.
Data correspond to usage on the plateform after 2015. The current usage metrics is available 48-96 hours after online publication and is updated daily on week days.
Initial download of the metrics may take a while.