Fig. 3.
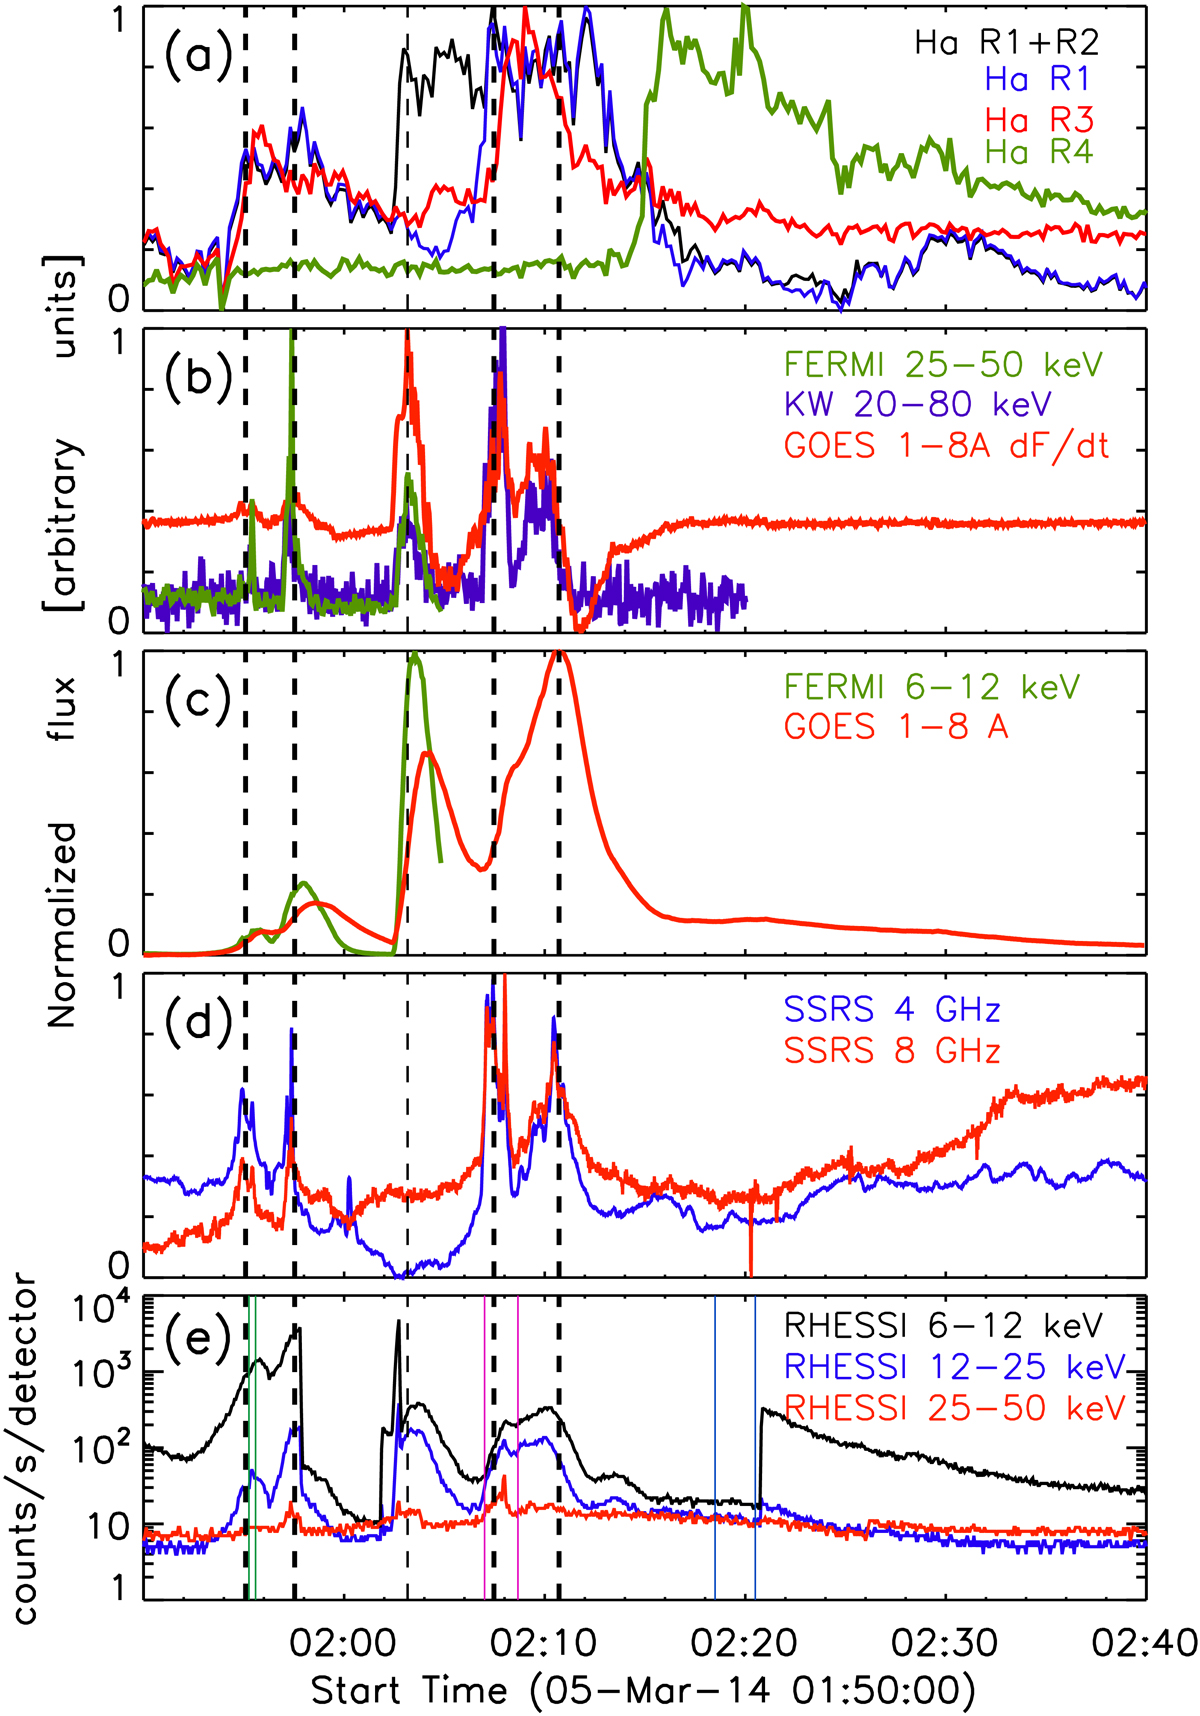
Normalised time profiles of the flare emission in different spectral ranges. All the time profiles are normalised by their maxima. A colour of each curve within a panel corresponds to the colour of the legend in the panel. Panel a: Hα emission from the sources R1+R2, R1, R3, and R4. Panel b: X-ray flux observed by Fermi/GBM at 25–50 keV and KW at 20–80 keV, and derivative of the GOES flux, at 1–8 Å. Panel c: X-ray fluxes registered by Fermi/GBM 6–12 keV, by GOES at 1–8 Å, and by GOES at 0.5–4 Å. Panel d: microwave fluxes at 8 GHz, 5.7 GHz, and 4 GHz obtained with SSRS. Panel e: X-ray uncorrected fluxes registered by RHESSI at 6–12 keV, 12–25 keV, and 25–50 keV. The RHESSI sources shown in Fig. 2 were reconstructed within time intervals enclosed into pairs of the same-coloured vertical solid lines.
Current usage metrics show cumulative count of Article Views (full-text article views including HTML views, PDF and ePub downloads, according to the available data) and Abstracts Views on Vision4Press platform.
Data correspond to usage on the plateform after 2015. The current usage metrics is available 48-96 hours after online publication and is updated daily on week days.
Initial download of the metrics may take a while.