Fig. 2.
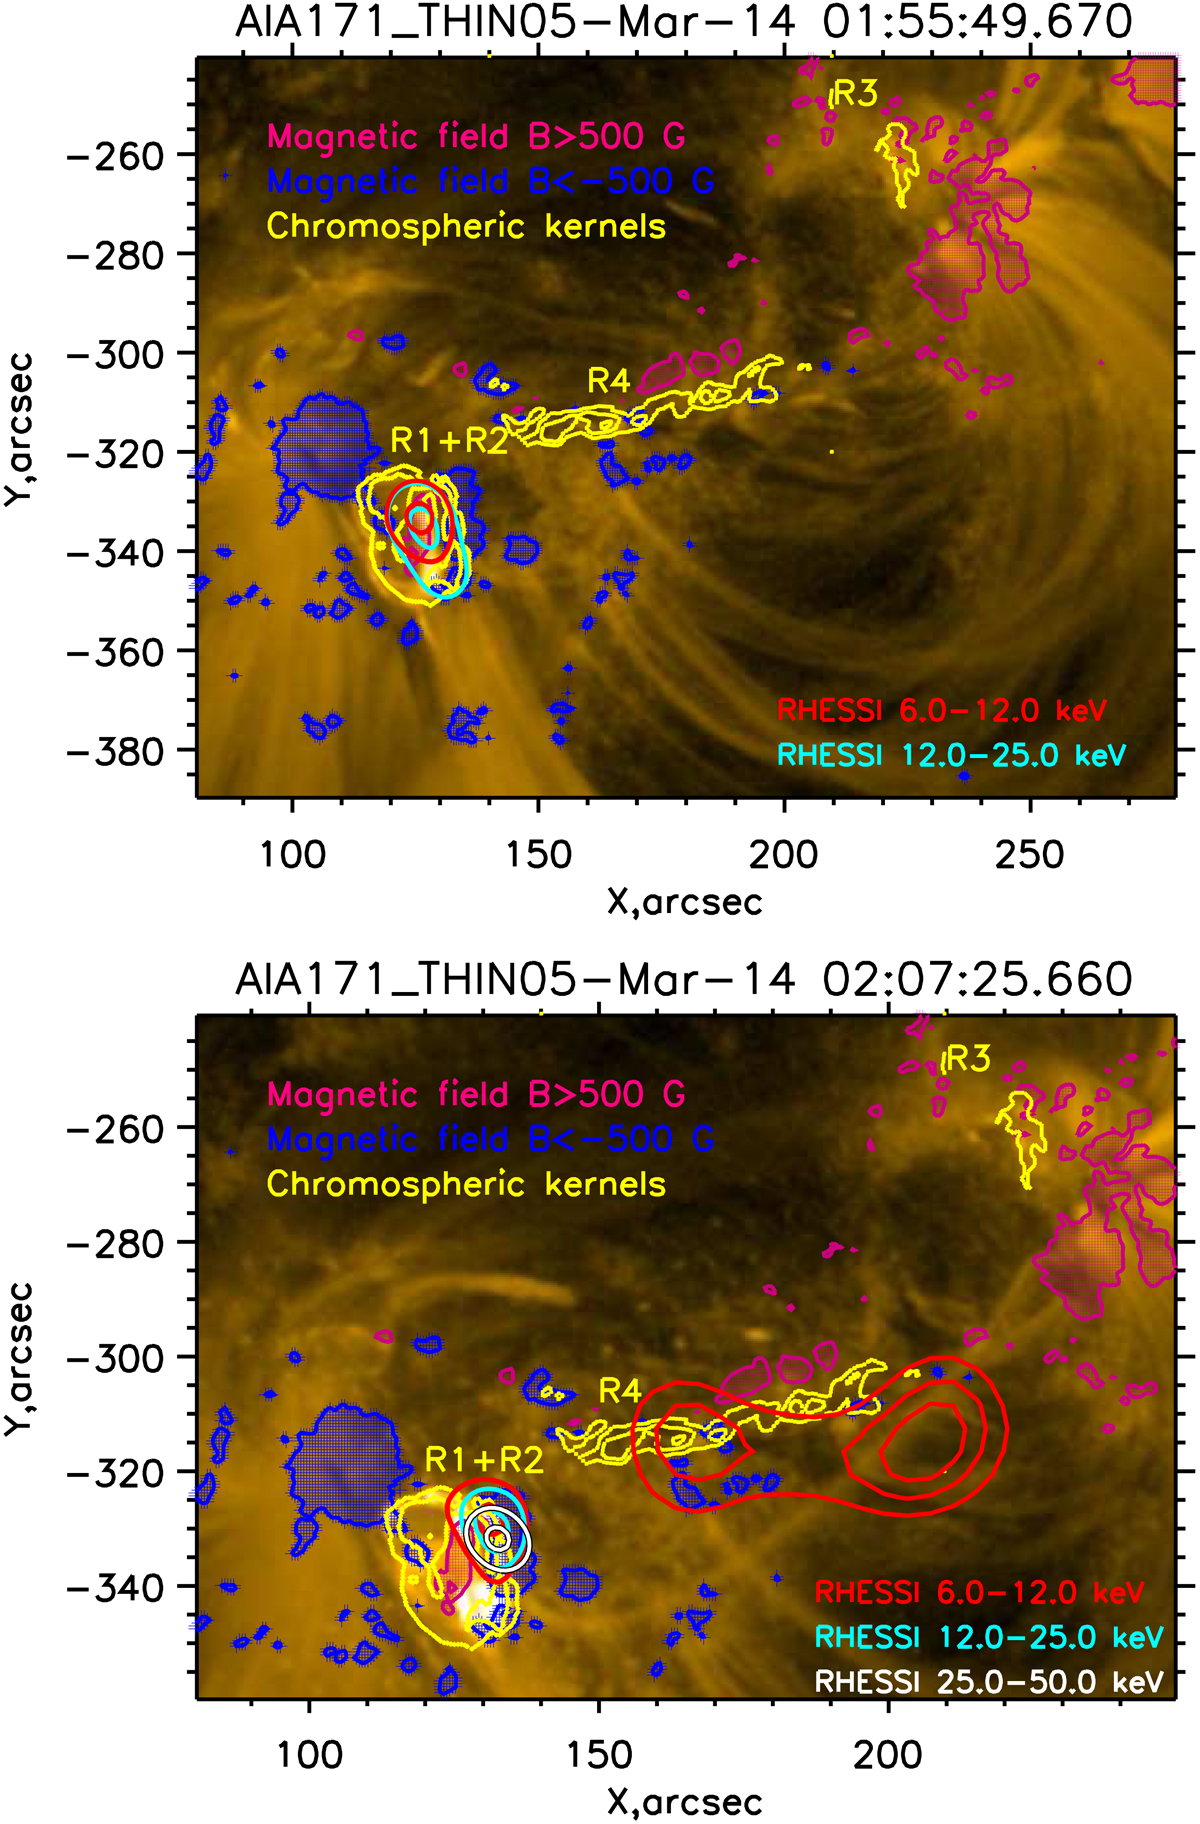
SDO/AIA 171 Å maps during the first flare at 01:57:12 UT (top) and during the second flare at 02:07:25 UT (bottom) with the over-plotted contours of hard X-ray emission at 6–12 keV (red), 12–25 keV (light green) and 25–50 keV (white). In the top panel, the X-ray images were reconstructed within 01:55:15–01:55:35 UT (the first peak) by the CLEAN algorithm. The X-ray sources shown by the solid line in the bottom panel were reconstructed within 02:07:00–02:08:40 UT by PIXON algorithm. The contour levels are 50% and 90% of maximum. The X-ray source associated with R4 was obtained by CLEAN algorithm within 02:18:30–02:20:30 UT. The levels are 40%, 60%, and 80% of maximum. The SDO/AIA 304 Å chromosperic kernels are marked by yellow. The magnetic field features of positive and negative polarity are marked by blue and magenta, correspondingly. The absolute value of magnetic feature strength is above 500 G.
Current usage metrics show cumulative count of Article Views (full-text article views including HTML views, PDF and ePub downloads, according to the available data) and Abstracts Views on Vision4Press platform.
Data correspond to usage on the plateform after 2015. The current usage metrics is available 48-96 hours after online publication and is updated daily on week days.
Initial download of the metrics may take a while.