Fig. 5.
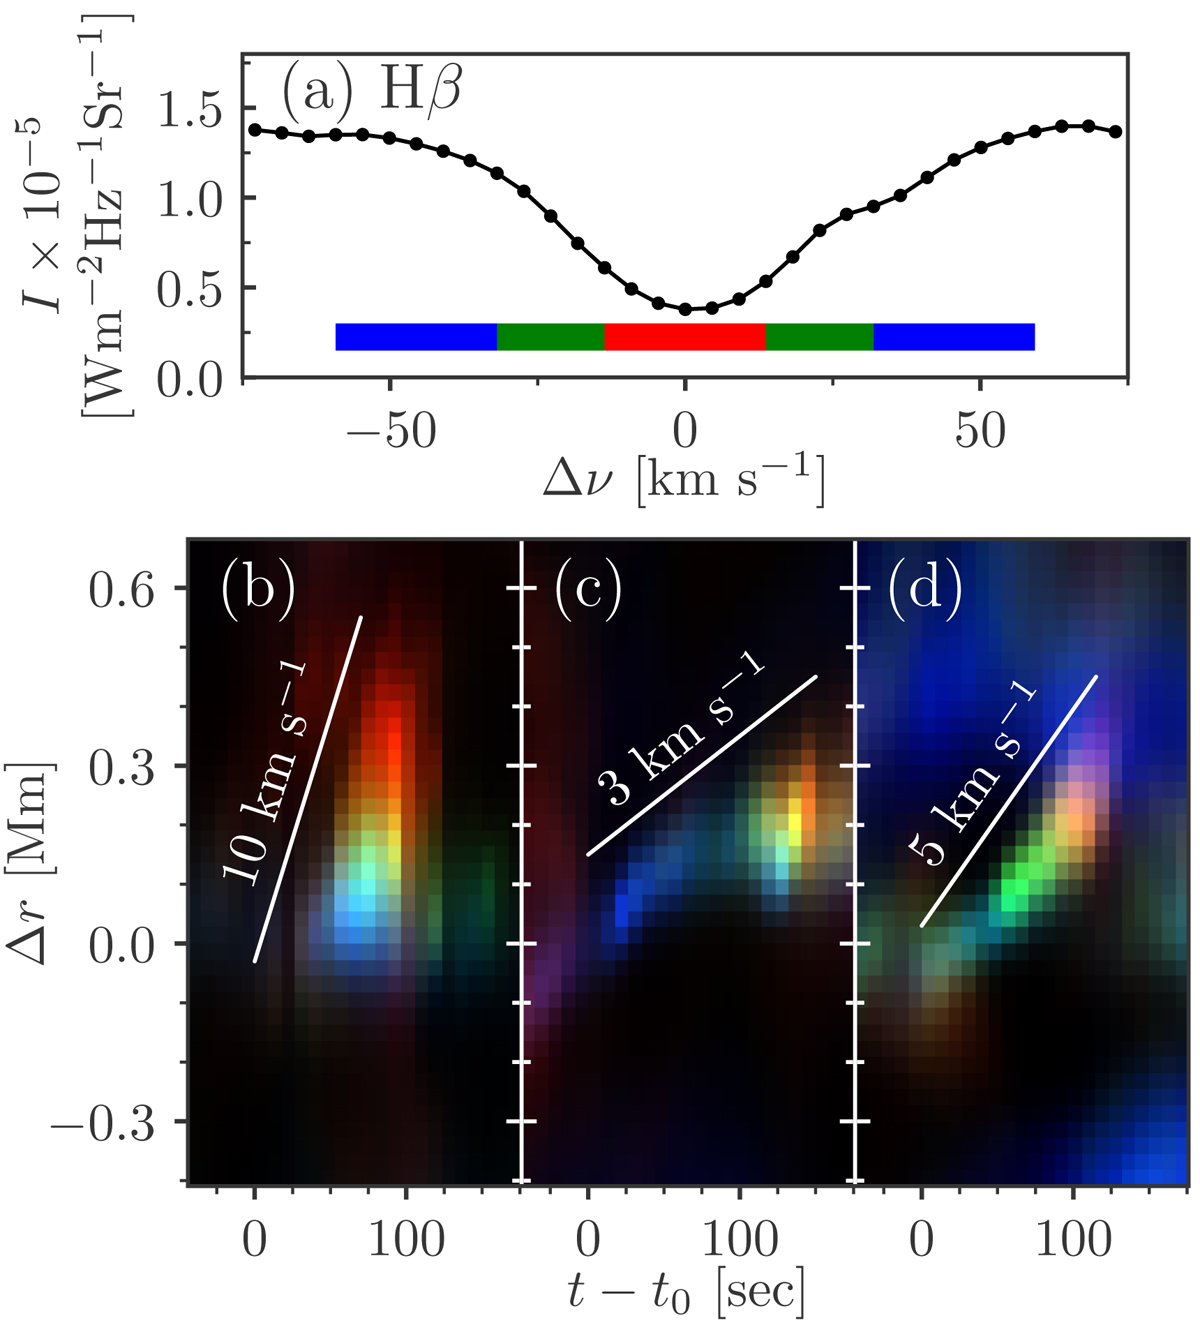
Space-time maps demonstrating progression of the QSEB brightening from the Hβ line wings to the line core in time and space. The space-time maps in panels b–d are constructed as RGB color images with the Hβ line core image in the red channel, flanks in the green, and wings in the blue. The space-time maps in panels b–d correspond to the QSEBs presented in Figs. 4, C.1, and C.2, respectively. The displayed space-time maps are created by averaging intensities along the width of the dotted rectangle plotted in the central image of the respective figures, and Δr representing the length of the rectangles. The white lines in panels b–d indicate the apparent speed by which the QSEB brightening progresses from the wings to the core in the Hβ line.
Current usage metrics show cumulative count of Article Views (full-text article views including HTML views, PDF and ePub downloads, according to the available data) and Abstracts Views on Vision4Press platform.
Data correspond to usage on the plateform after 2015. The current usage metrics is available 48-96 hours after online publication and is updated daily on week days.
Initial download of the metrics may take a while.