Fig. 4.
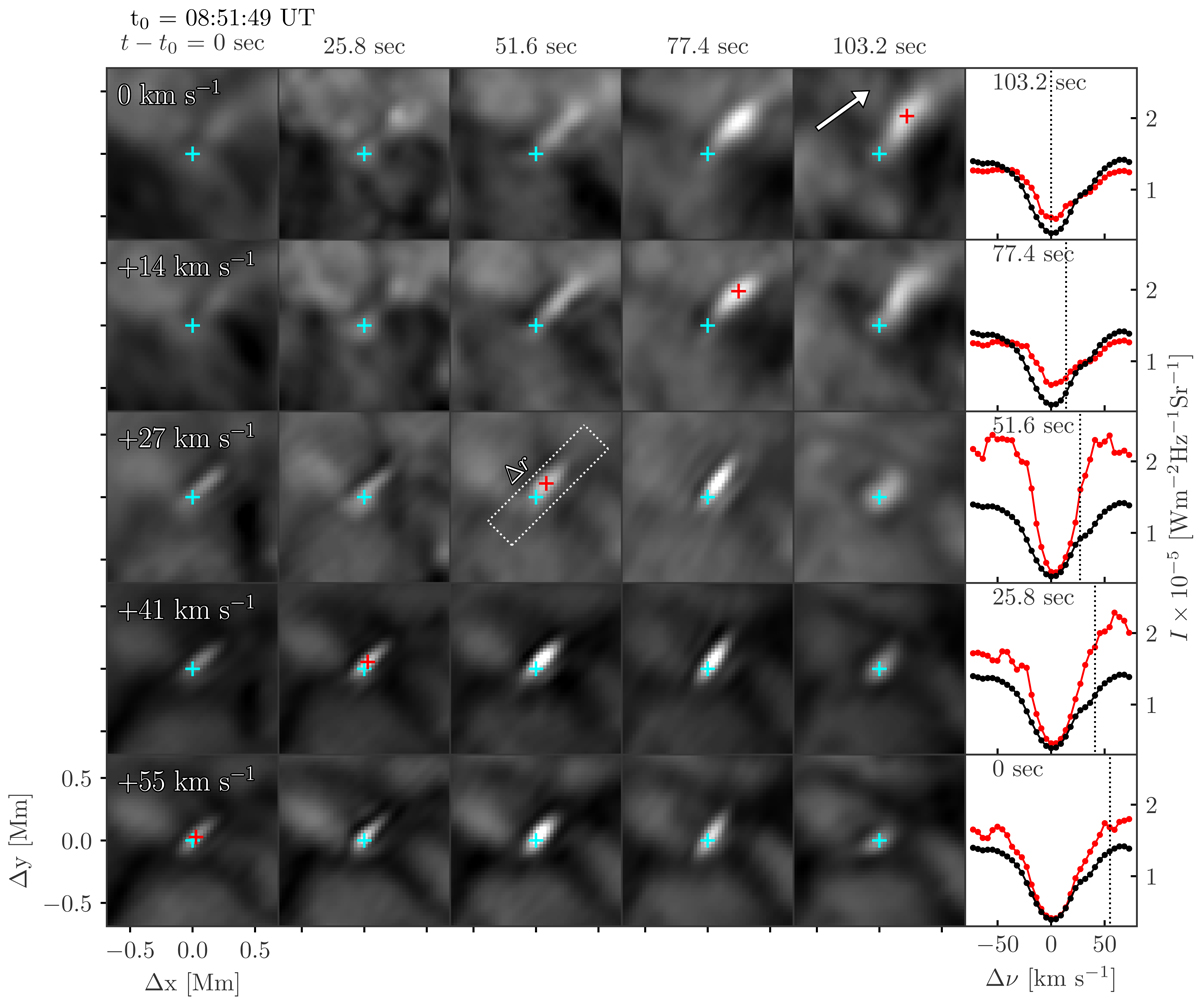
Temporal evolution of a QSEB. Time progresses along the rows of Hβ images from left to right; the Doppler offset varies along the columns from the line core at the top to the far wing at the bottom. The rightmost column shows the evolution of the QSEB Hβ line profiles in red (the location of the line profile is given by the red plus sign in the images); the black line is a reference profile averaged over the presented FOV. The vertical dotted line gives the Doppler offset in the corresponding row. The Hβ profile is selected from the location of maximum intensity at that Doppler offset within the area of the QSEB. The cyan plus sign in each panel indicates the centre of the FOV. The dotted rectangle (center panel) shows the area used to create the space-time map displayed in Fig. 5b.
Current usage metrics show cumulative count of Article Views (full-text article views including HTML views, PDF and ePub downloads, according to the available data) and Abstracts Views on Vision4Press platform.
Data correspond to usage on the plateform after 2015. The current usage metrics is available 48-96 hours after online publication and is updated daily on week days.
Initial download of the metrics may take a while.