Fig. 2.
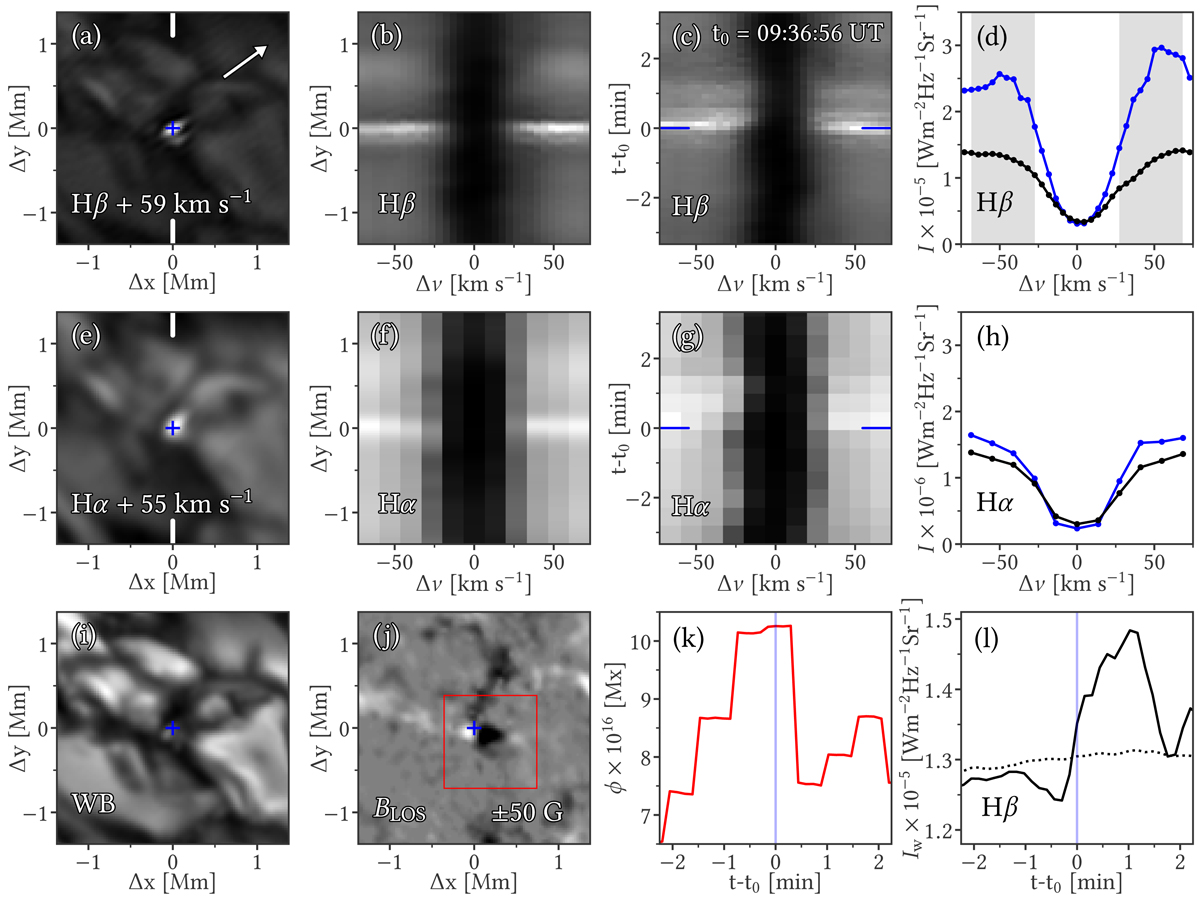
Details of a QSEB in Hβ and Hα. (a) QSEB observed in the Hβ red wing. (b) Spatial variations in the Hβ line profile along the y-axis crossing the QSEB and shown by the two vertical white lines in (a). Here the spectral dimension is presented in terms of Doppler offset. (c) Temporal variations in the Hβ line profile for a location in the QSEB indicated by the blue plus sign in (a). (d) Hβ line profile at the brightest pixel in the QSEB and an average quiet Sun reference profile (black line). (e–h) Similar to (a–d), but in Hα. (i) Corresponding WB image, and (j) Map of BLOS. (k) Evolution of the BLOS flux (ϕ) within the red box shown in (j). (l) Light curves of the intensity variations of the QSEB (solid) and averaged over the FOV presented in this figure (dotted). Both the curves are averages of intensities in the Hβ line wings (Iw) as marked by the gray shaded area in (d). An animation showing evolution of the QSEB is available online.
Current usage metrics show cumulative count of Article Views (full-text article views including HTML views, PDF and ePub downloads, according to the available data) and Abstracts Views on Vision4Press platform.
Data correspond to usage on the plateform after 2015. The current usage metrics is available 48-96 hours after online publication and is updated daily on week days.
Initial download of the metrics may take a while.