Fig. 1.
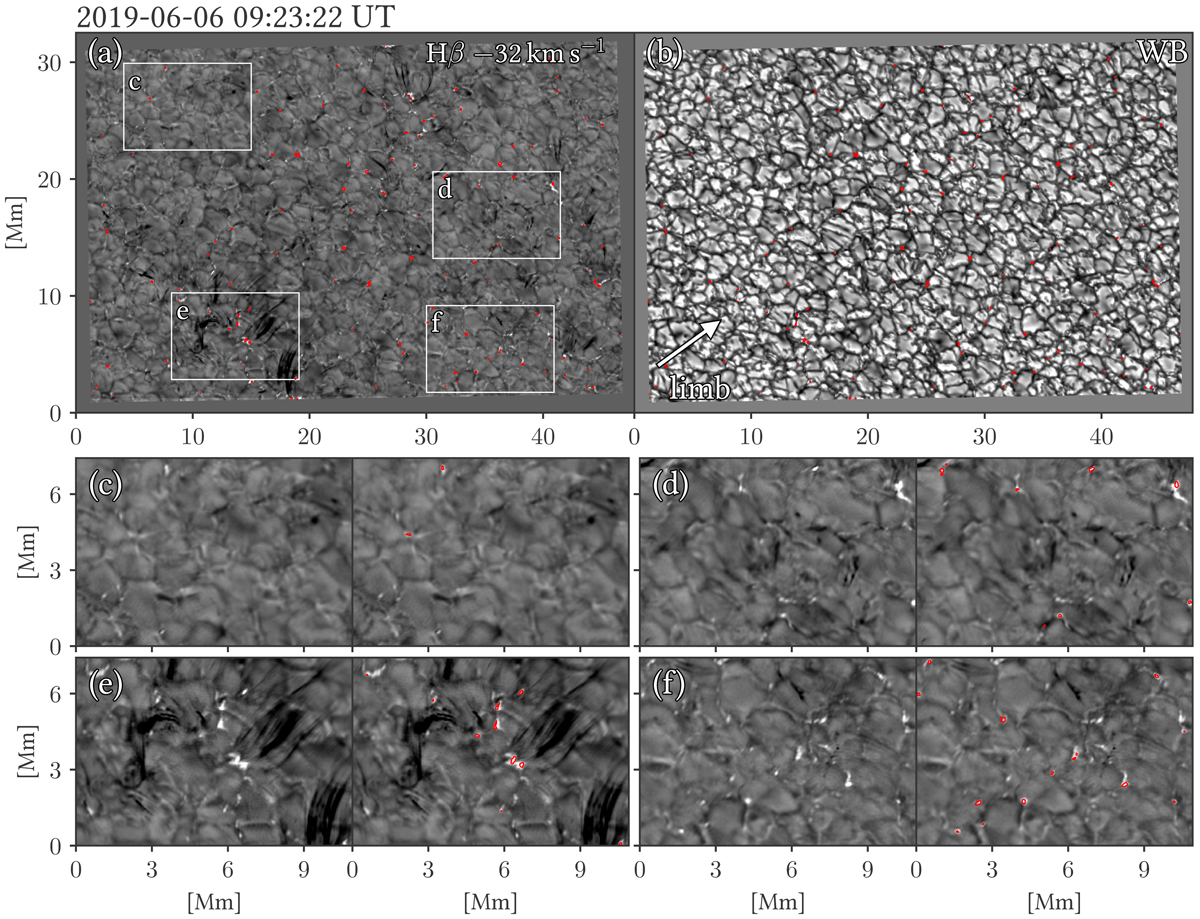
Ubiquitous QSEB detections using the k-means clustering technique. (a) Observed FOV in the Hβ blue wing. The red contours indicate the location of QSEBs. (b) Co-temporal continuum WB image. (c–f) Zoom-in on the four different areas indicated by the white boxes in (a); each panel shows duplicate images, one with the red contours indicating the location of QSEBs and one without the contours. The arrow in panel b shows the direction of the closest solar limb. An animation of this figure is available online.
Current usage metrics show cumulative count of Article Views (full-text article views including HTML views, PDF and ePub downloads, according to the available data) and Abstracts Views on Vision4Press platform.
Data correspond to usage on the plateform after 2015. The current usage metrics is available 48-96 hours after online publication and is updated daily on week days.
Initial download of the metrics may take a while.