Fig. 9
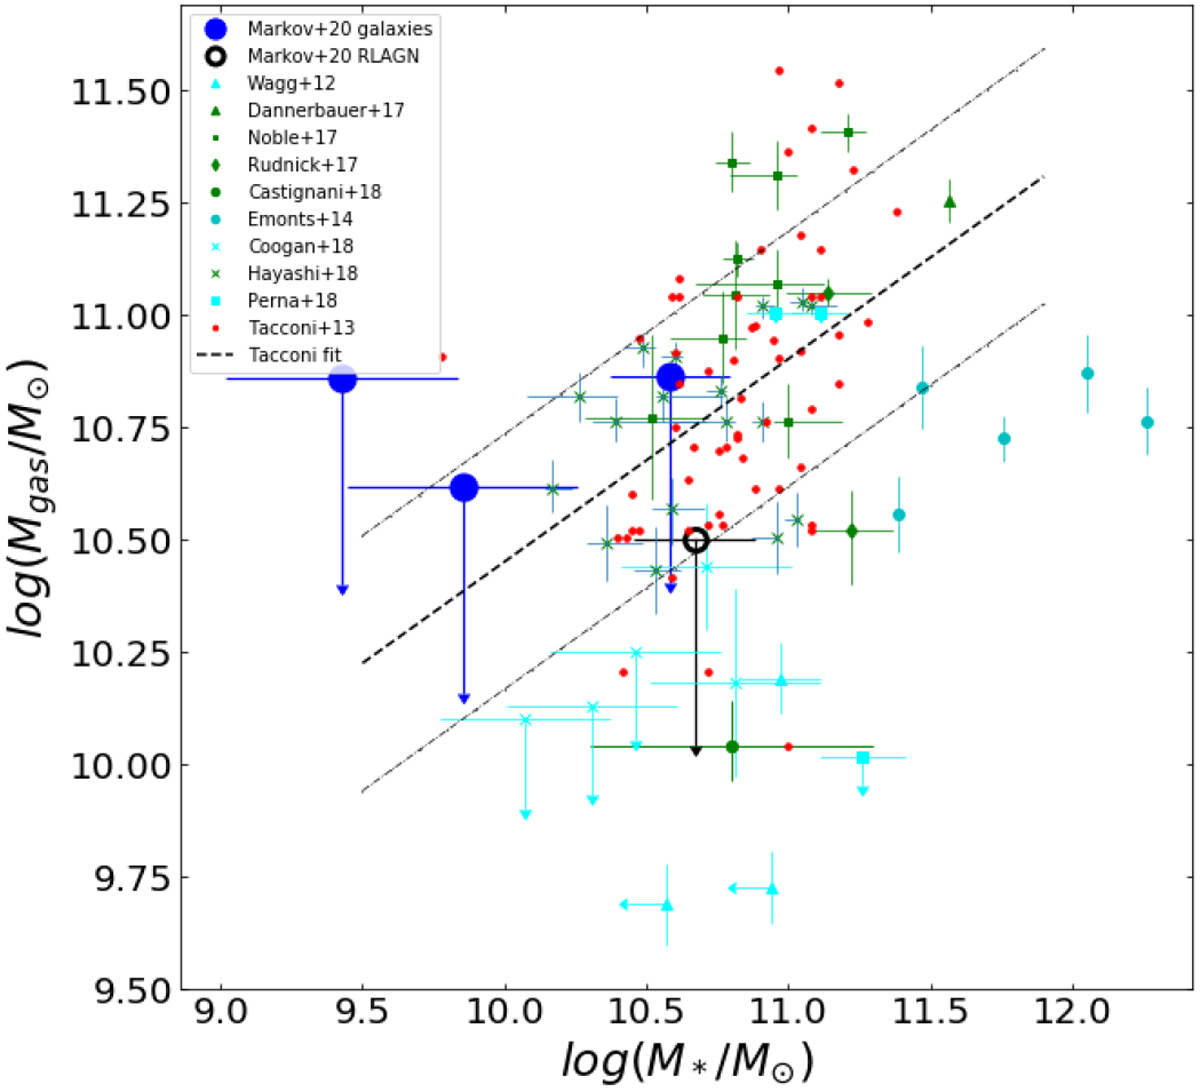
Molecular gas mass vs. stellar mass relation for the AGN (empty black circles) and for other CARLA J1103 + 3449 spectroscopically confirmed cluster members (blue filled circles) compared to other cluster (green and cyan) and field galaxies (red) from the literature. The arrows show lower and upper limits. Green markers are the results for cluster galaxies for which gas masses were estimated using the Galactic conversion factor. Cyan markers are estimations with different values of the conversion factor. Dashed and dashed-dotted lines represent the Tacconi et al. (2013) relation for field star-forming galaxies and its 1σ scatter.
Current usage metrics show cumulative count of Article Views (full-text article views including HTML views, PDF and ePub downloads, according to the available data) and Abstracts Views on Vision4Press platform.
Data correspond to usage on the plateform after 2015. The current usage metrics is available 48-96 hours after online publication and is updated daily on week days.
Initial download of the metrics may take a while.