Fig. 7
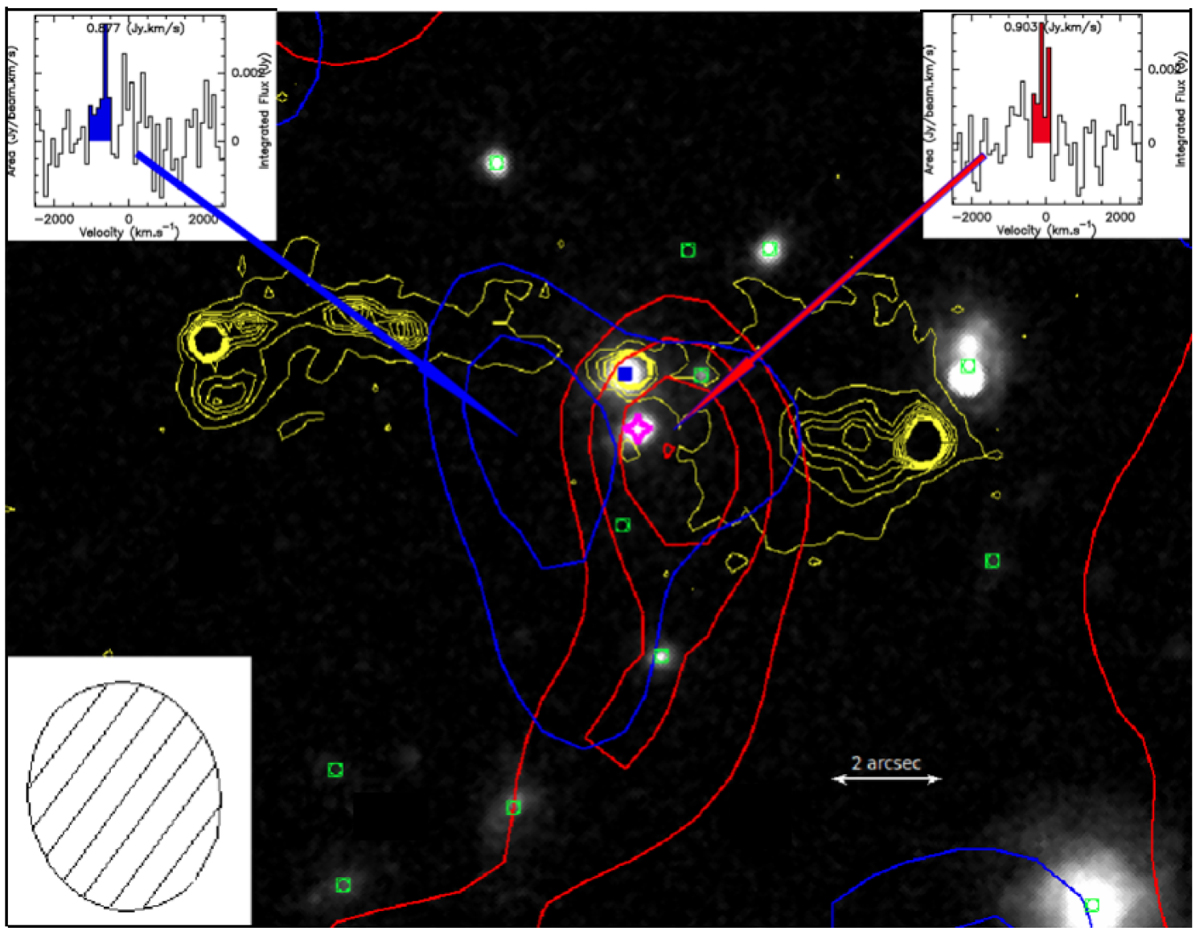
HST/WFC3 F140W image of the central region of the cluster, with contours of CO(2–1) emission of the eastern and western emission peaks (shown as blue and red contours, respectively), and the radio emission at 4.71 GHz (yellow) from the work of Best et al. (1999). The central peak of the radio emission corresponds to the position of the AGN. The two radio lobes are asymmetrical, with the one to the east (left of the AGN) being more compact and the one to the west more diffuse. The central blue square and the pink star with four spikes show the position of the AGN and of the star, respectively. The green squares are the positions of IRAC color-selected galaxies in the cluster’s central region. The contours are derived by integrating the CO(2–1) emission across the velocities marked by their corresponding color on the CO(2–1) emission line spectra. The spectra are shown in the top left and right insets (see Appendix A for more details). The contour levels of the eastern and western emission peaks are 1–2σ and 1–4σ, respectively. The eastern and western emission peaks are south of the AGN, and do not correspond to any galaxy detected on the HST or Spitzer images. North is up and east is to the left. The beam scale is shown on the bottom left.
Current usage metrics show cumulative count of Article Views (full-text article views including HTML views, PDF and ePub downloads, according to the available data) and Abstracts Views on Vision4Press platform.
Data correspond to usage on the plateform after 2015. The current usage metrics is available 48-96 hours after online publication and is updated daily on week days.
Initial download of the metrics may take a while.