Fig. 5
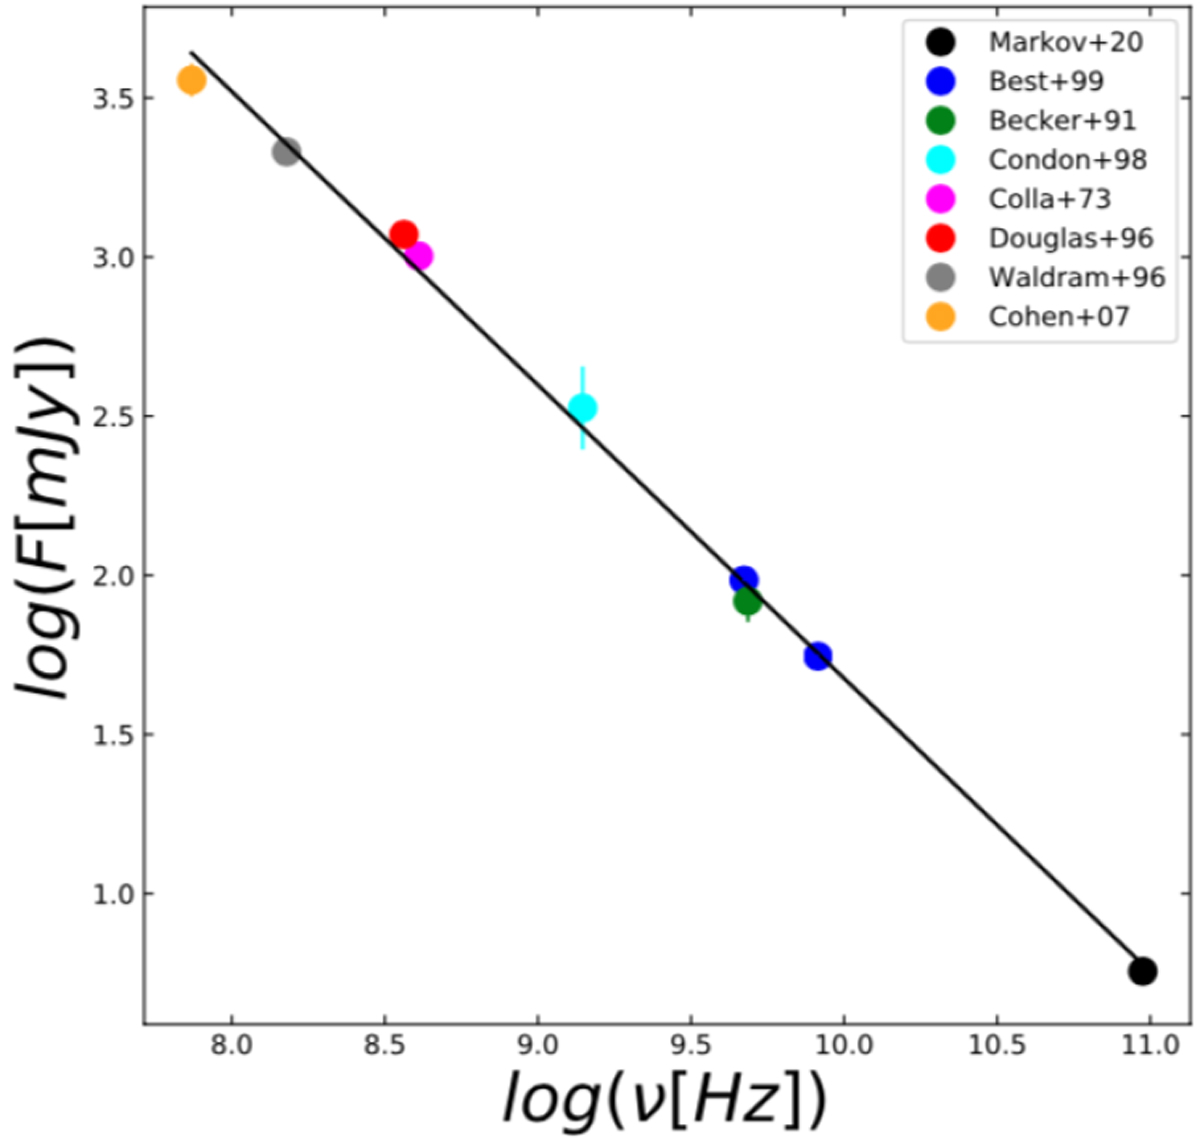
Total SED plot of the AGN in the radio and millimeter wavebands from our work (black), Best et al. (1999) (blue), Becker et al. (1991) (green), Condon et al. (1998) (cyan), Colla et al. (1973) (magenta), Douglas et al. (1996) (red), Waldram et al. (1996) (gray), and Cohen et al. (2007) (orange). Over this range of frequencies, we obtain an AGN spectral index of α = 0.92 ± 0.02.
Current usage metrics show cumulative count of Article Views (full-text article views including HTML views, PDF and ePub downloads, according to the available data) and Abstracts Views on Vision4Press platform.
Data correspond to usage on the plateform after 2015. The current usage metrics is available 48-96 hours after online publication and is updated daily on week days.
Initial download of the metrics may take a while.