Fig. 4
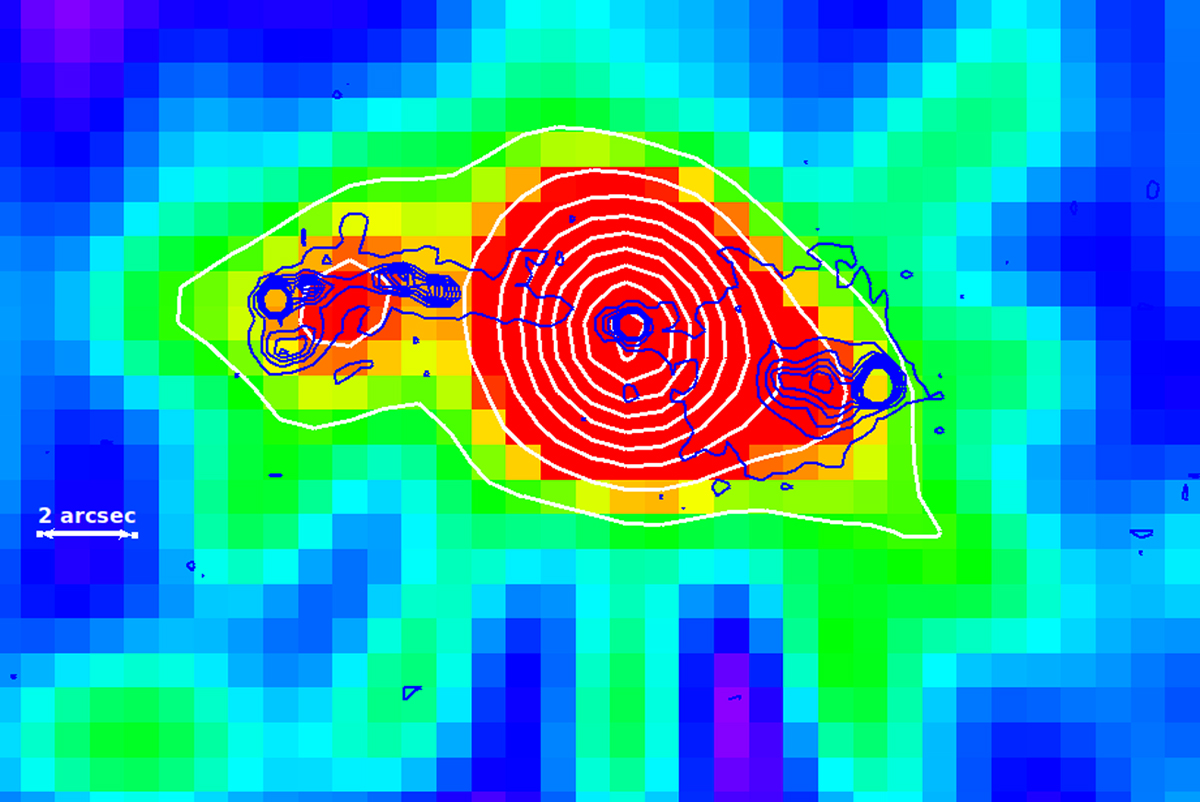
Zoom-in on the continuum emission map of the extended source in the cluster center. The continuum emission contours (white) run as 3σ, 6σ, 9σ, etc. up to 24σ. The radio emission contours at 4.71 GHz from the work of Best et al. (1999) are overlaid on the image (in blue). The brightest continuum emission peak and one of the radio peaks are both centered on the AGN. The continuum emissions visually correspond to the position of the radio jets, suggesting the same or a connected physical origin. North is up and east is to the left.
Current usage metrics show cumulative count of Article Views (full-text article views including HTML views, PDF and ePub downloads, according to the available data) and Abstracts Views on Vision4Press platform.
Data correspond to usage on the plateform after 2015. The current usage metrics is available 48-96 hours after online publication and is updated daily on week days.
Initial download of the metrics may take a while.