Fig. 3
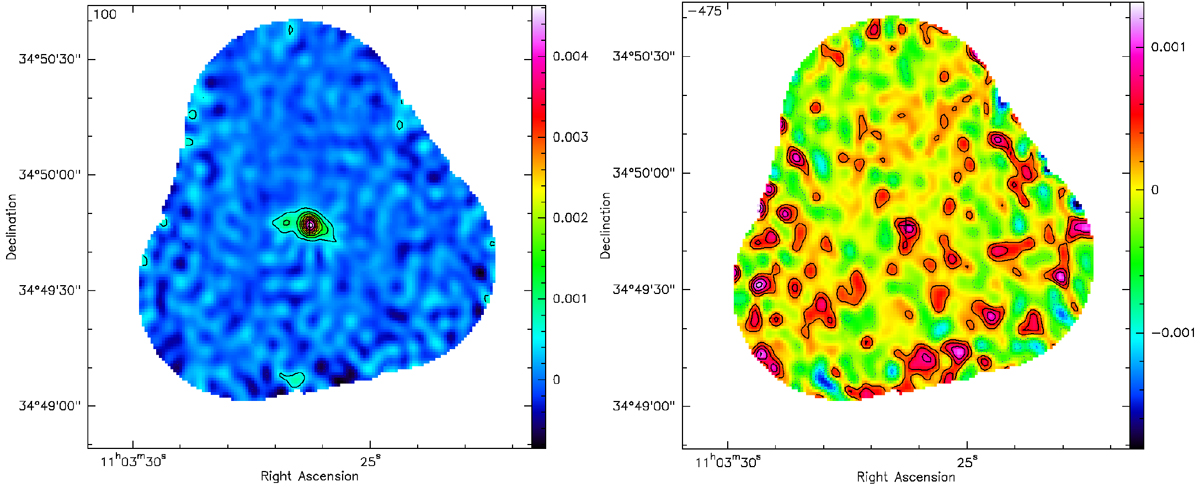
Left: continuum emission map of the CARLA J1103 + 3449 cluster at 94.48 GHz. The map was obtained by averaging the flux over a velocity range of 2450 km s−1, outside of the emission lines. The rms noise level is σ ~ 0.2 mJy beam−1 in the central pointing intersection region, and the contours show the 3σ, 6σ, 9σ, etc. levels upto 24σ. Right: continuum subtracted CO(2–1) line emission mosaic map. The color wedge of the intensity maps is in Jy beam−1. The map was obtained by averaging the flux over a velocity range of 1200 km s−1, and has an average rms noise level of σ ~ 0.2 mJy beam−1 in the central pointing intersection region. The continuous lines show positive σ contours andthe dotted lines show negative σ contours. The contours show the 1σ, 2σ, and 3σ levels. The cross marks the phase center of the mosaic. The noise approximately doubles toward the map edges because of the primary beam correction. Both maps show an extended source in the cluster center.
Current usage metrics show cumulative count of Article Views (full-text article views including HTML views, PDF and ePub downloads, according to the available data) and Abstracts Views on Vision4Press platform.
Data correspond to usage on the plateform after 2015. The current usage metrics is available 48-96 hours after online publication and is updated daily on week days.
Initial download of the metrics may take a while.