Open Access
Fig. A.3
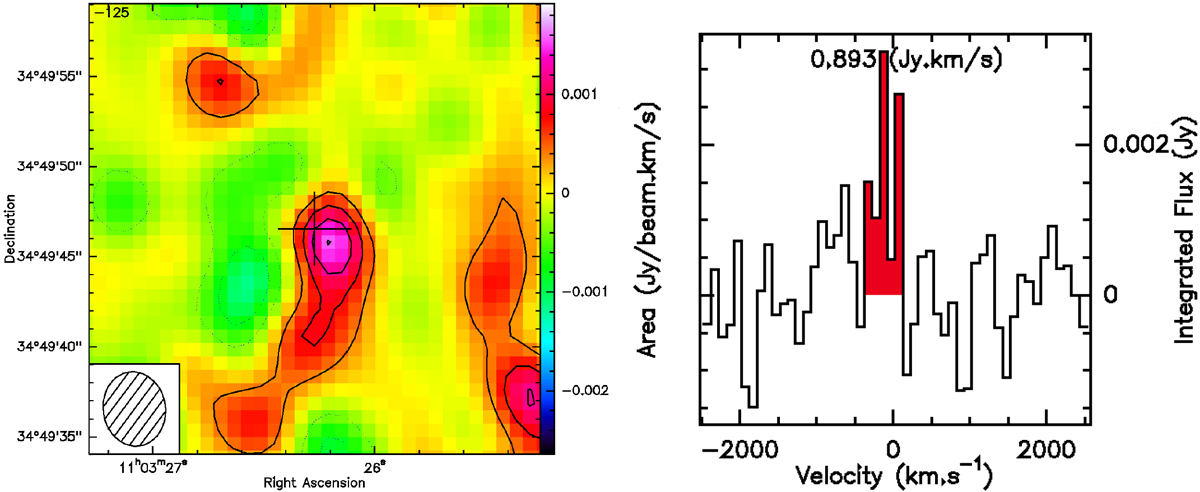
Left: CO(2–1) line emission intensity map of the central cluster region with NOEMA created by selecting the channel ranges that include only the western emission peak (on the right). The spectra are binned in channels of 100 km s−1. The contour levels are 1σ, 2σ, 3σ, and 4σ.
Current usage metrics show cumulative count of Article Views (full-text article views including HTML views, PDF and ePub downloads, according to the available data) and Abstracts Views on Vision4Press platform.
Data correspond to usage on the plateform after 2015. The current usage metrics is available 48-96 hours after online publication and is updated daily on week days.
Initial download of the metrics may take a while.