Fig. 10
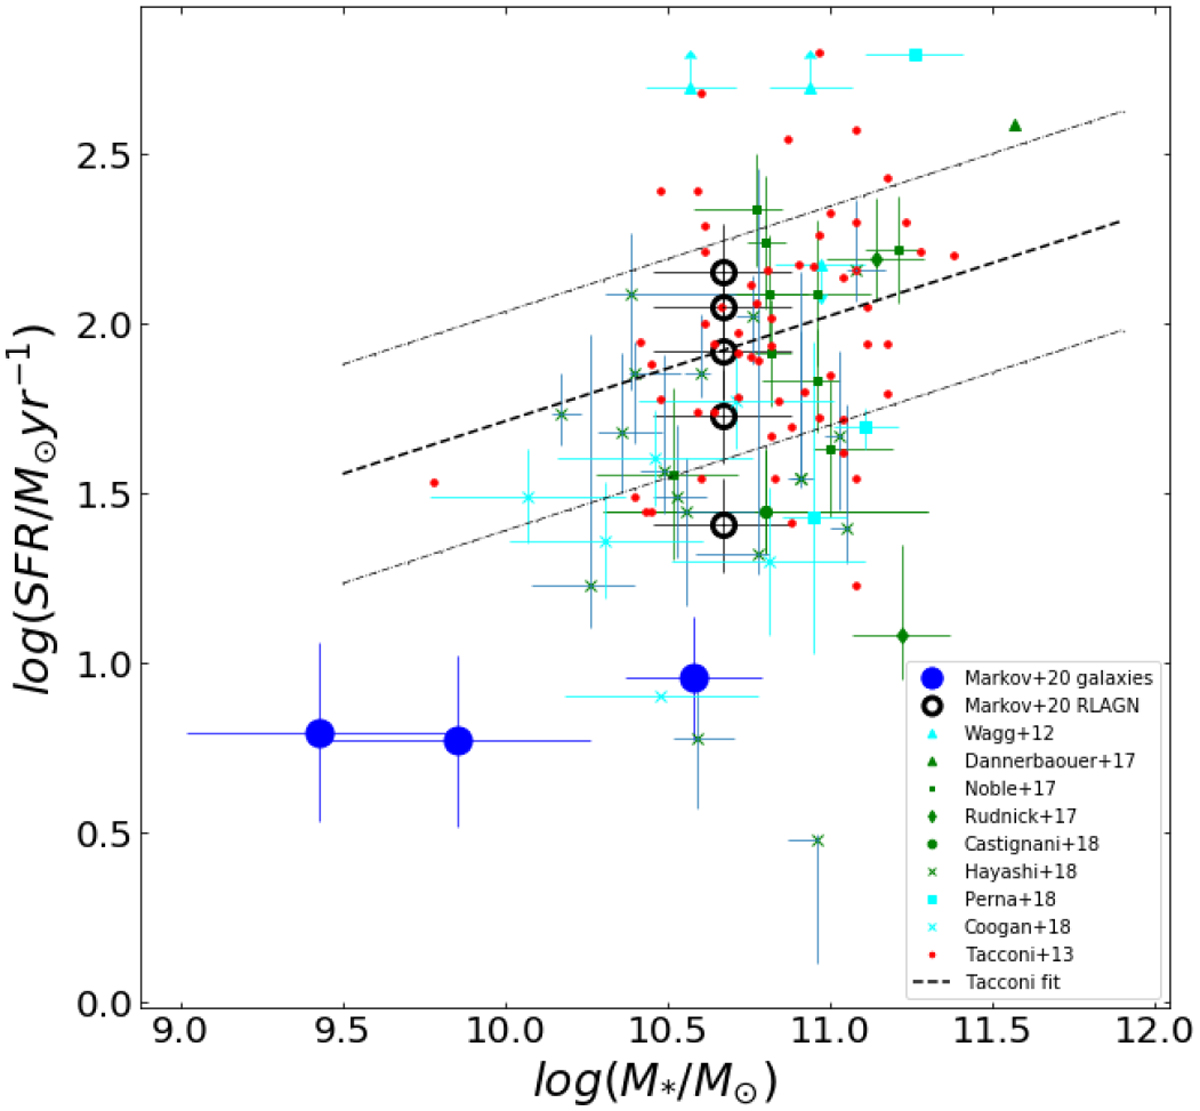
Star formation rate as a function of stellar mass. Symbols are the same as in Fig. 9. The AGN SFR is shown with different contributions of the Hα+[NII] stellar emission to the total flux. We compare our results with those from other works. The dashed and the dashed-dotted lines represent the best fit with 1σ scatter for the MS of field galaxies from Tacconi et al. (2013).
Current usage metrics show cumulative count of Article Views (full-text article views including HTML views, PDF and ePub downloads, according to the available data) and Abstracts Views on Vision4Press platform.
Data correspond to usage on the plateform after 2015. The current usage metrics is available 48-96 hours after online publication and is updated daily on week days.
Initial download of the metrics may take a while.