Free Access
Fig. 12
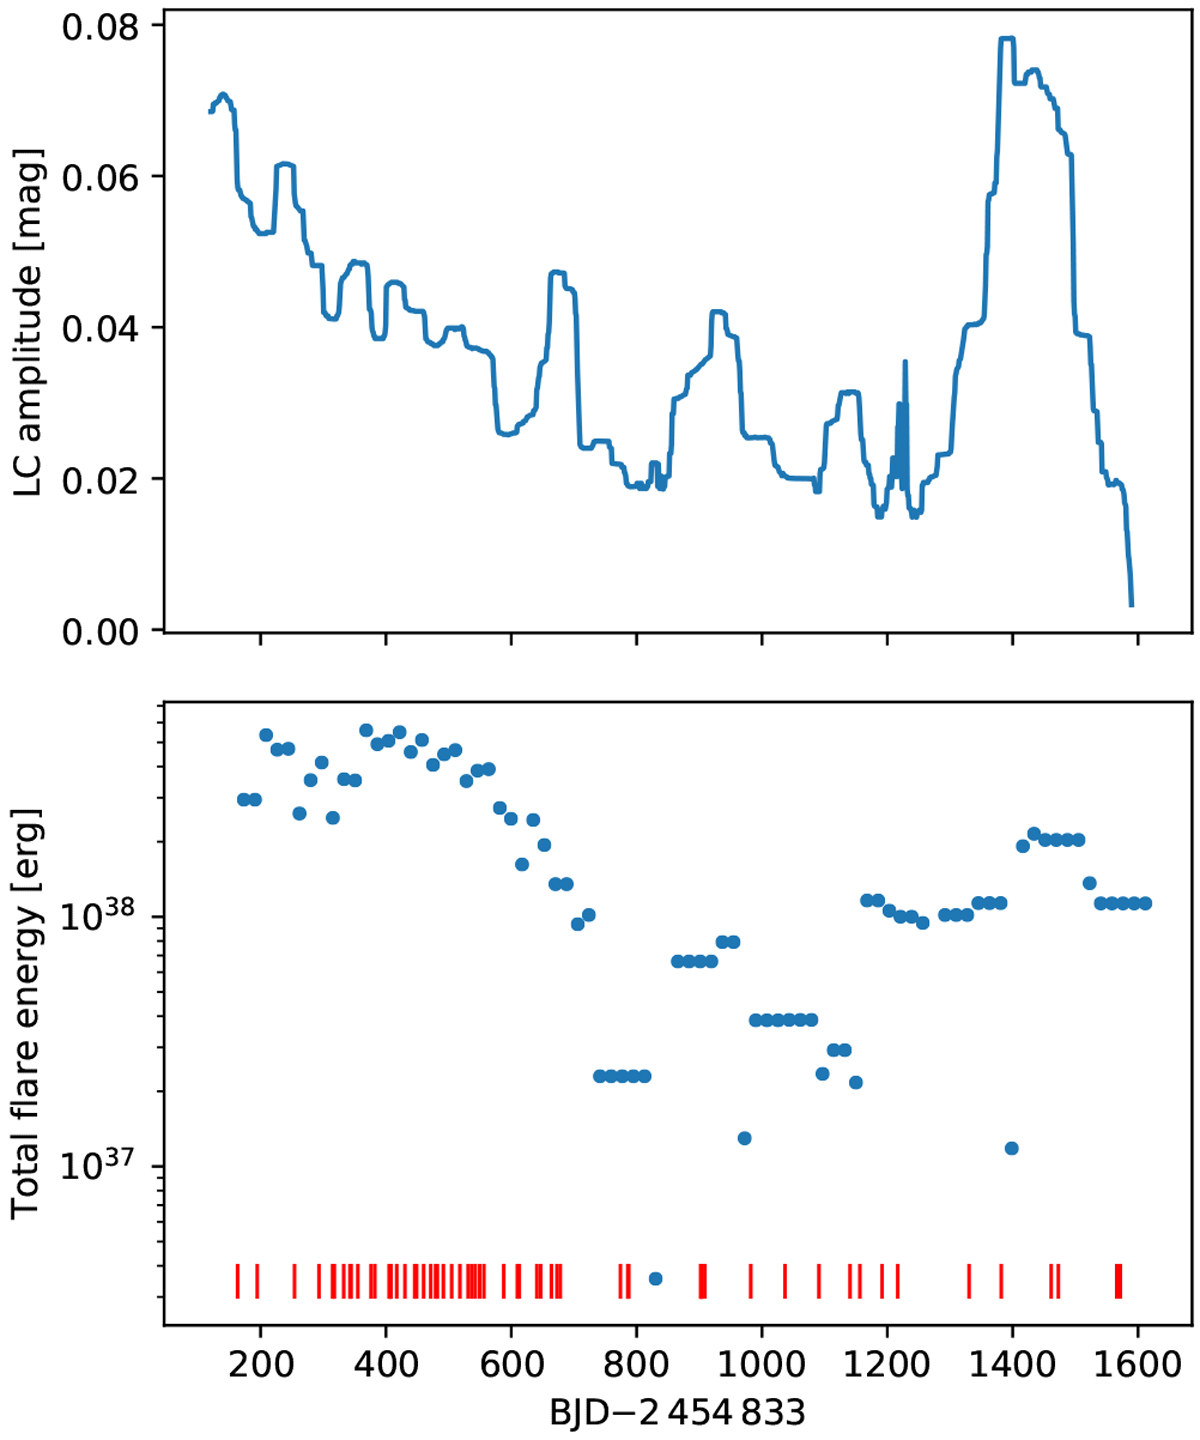
Top: moving average of the amplitude of rotational modulation in the Kepler light curve of KIC 2852961 shown in Fig. 4. Bottom: total flare energy within the boxcar of 3Prot used for the moving average. The red tick marks below indicate the peak times of the flare events. See the text for details.
Current usage metrics show cumulative count of Article Views (full-text article views including HTML views, PDF and ePub downloads, according to the available data) and Abstracts Views on Vision4Press platform.
Data correspond to usage on the plateform after 2015. The current usage metrics is available 48-96 hours after online publication and is updated daily on week days.
Initial download of the metrics may take a while.