Fig. 10
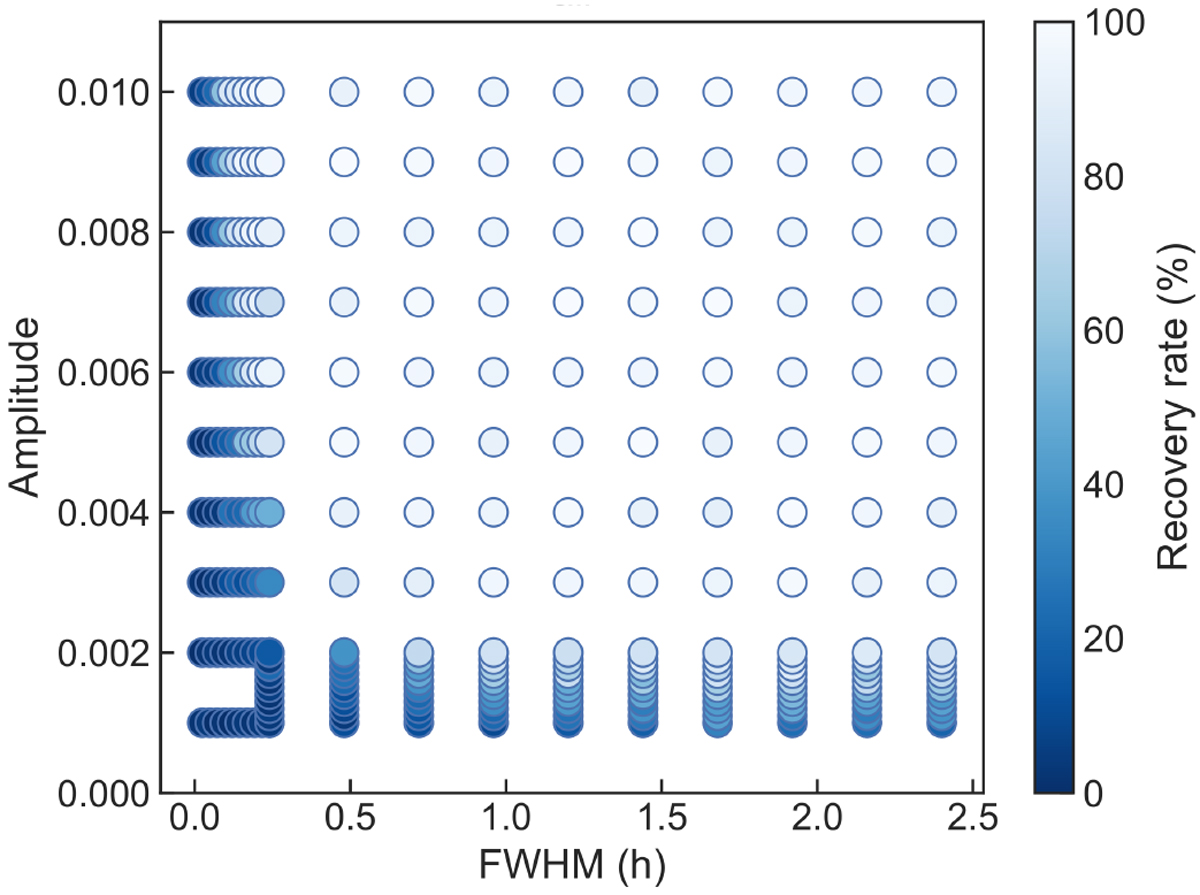
Result of the injection-recovery test. Each circle on the plot represents a given model flare characterized by its FWHM and amplitude. The recovery rate of the model flares is represented by a blue gradient bar (the darker the shade, the lower the recovery rate). The energy range in total logarithmic flare energy extends from log E = 33.78 [erg] up to 36.78 [erg], where the recovery rate virtually reaches 100%.
Current usage metrics show cumulative count of Article Views (full-text article views including HTML views, PDF and ePub downloads, according to the available data) and Abstracts Views on Vision4Press platform.
Data correspond to usage on the plateform after 2015. The current usage metrics is available 48-96 hours after online publication and is updated daily on week days.
Initial download of the metrics may take a while.