Fig. 9.
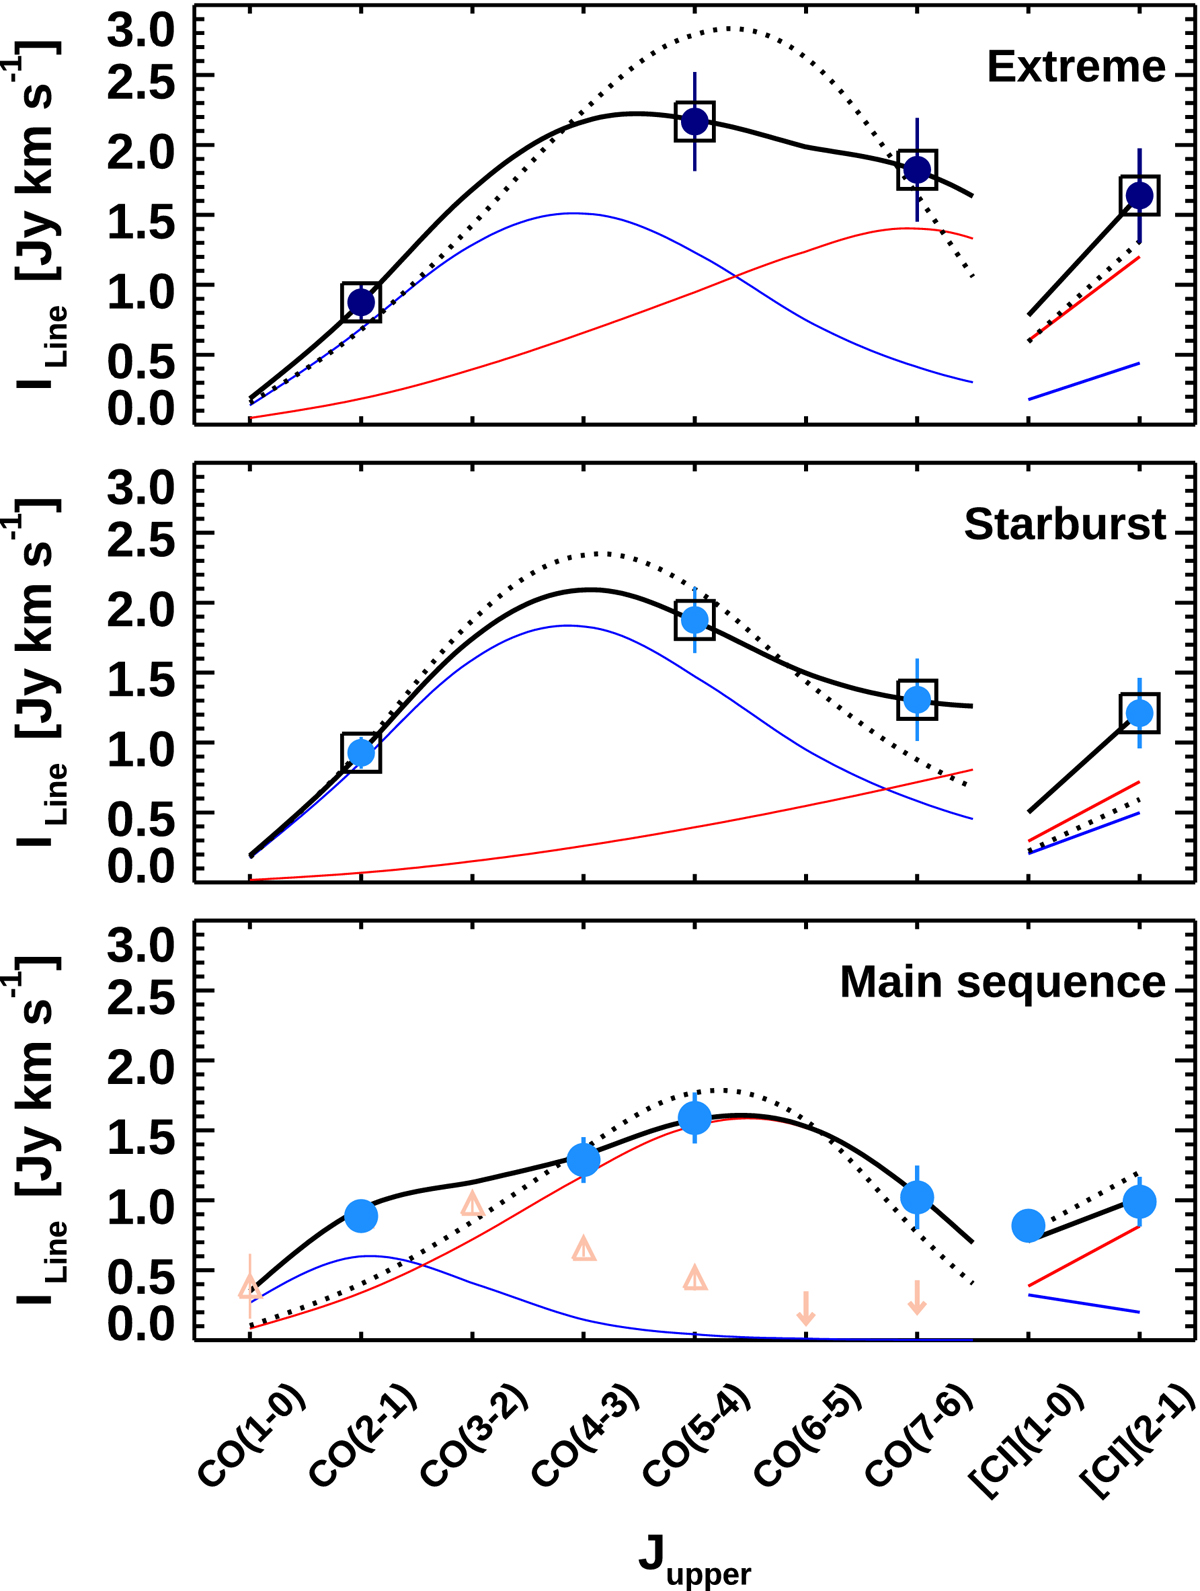
LVG modeling. Large velocity gradient modeling of the observed CO+[C I] SLEDs for main-sequence (bottom panel), starburst (ΔMS ≥ 3.5, central panel), and extreme starburst galaxies (ΔMS ≥ 7, top panel) from our ALMA survey. The filled symbols show the mean fluxes. The blue and red lines show the low- and high-excitation components of the modeling, with the black solid line indicating their sum. The dotted black line shows the best-fit model with a single component. For reference, we show the CO data for the inner disk of the Milky Way (Fixsen et al. 1999) normalized to the CO (2 − 1) emission of the average main-sequence galaxies as in Fig. 8 (pink open triangles). The upper limits are at 3σ significance.
Current usage metrics show cumulative count of Article Views (full-text article views including HTML views, PDF and ePub downloads, according to the available data) and Abstracts Views on Vision4Press platform.
Data correspond to usage on the plateform after 2015. The current usage metrics is available 48-96 hours after online publication and is updated daily on week days.
Initial download of the metrics may take a while.