Fig. 7.
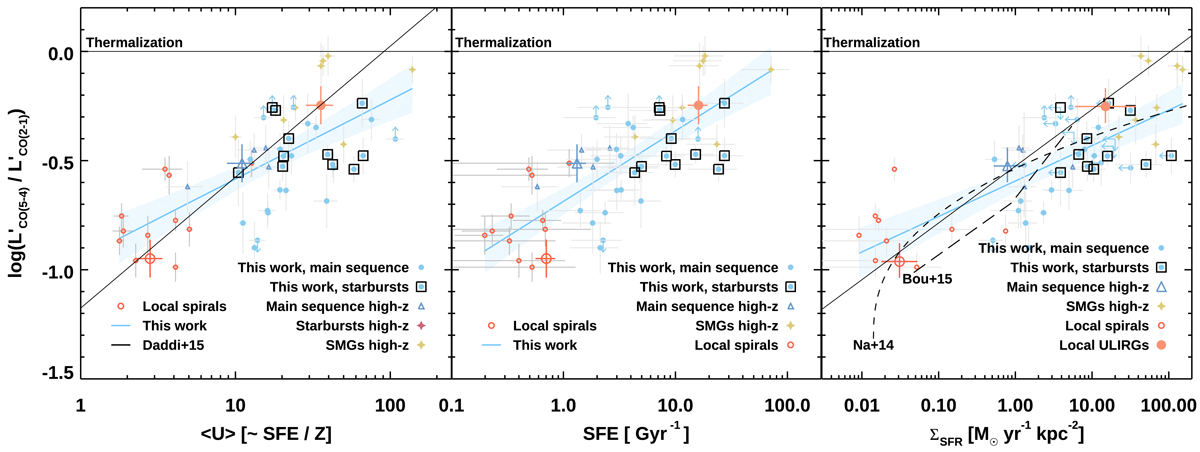
Physical drivers of the CO excitation. L′ [K km s−1 pc2] luminosity ratio between CO (5 − 4) and CO (2 − 1) as a function of ⟨U⟩ from SED modeling (left), SFE (center), and ΣSFR (right). Symbols are color-coded as labeled (see Sect. 3.6 for references), where our samples of main-sequence and starburst galaxies at z ∼ 1.3 are marked by blue filled circles and open black squares, respectively. The solid blue line and the shaded area mark the best-fit model from the linear regression analysis and its 95% confidence interval (see Table 3 for the parameters). The solid black line shows the best-fit model from D15, based on the average values for local spirals, ULIRGs, and BzKs at z = 1.5 (large open red circle, filled red circle, and open blue triangle, respectively). The short- and long-dashed black lines in the right panel indicate the predicted trends from the simulations by Narayanan & Krumholz (2014) and Bournaud et al. (2015), respectively.
Current usage metrics show cumulative count of Article Views (full-text article views including HTML views, PDF and ePub downloads, according to the available data) and Abstracts Views on Vision4Press platform.
Data correspond to usage on the plateform after 2015. The current usage metrics is available 48-96 hours after online publication and is updated daily on week days.
Initial download of the metrics may take a while.