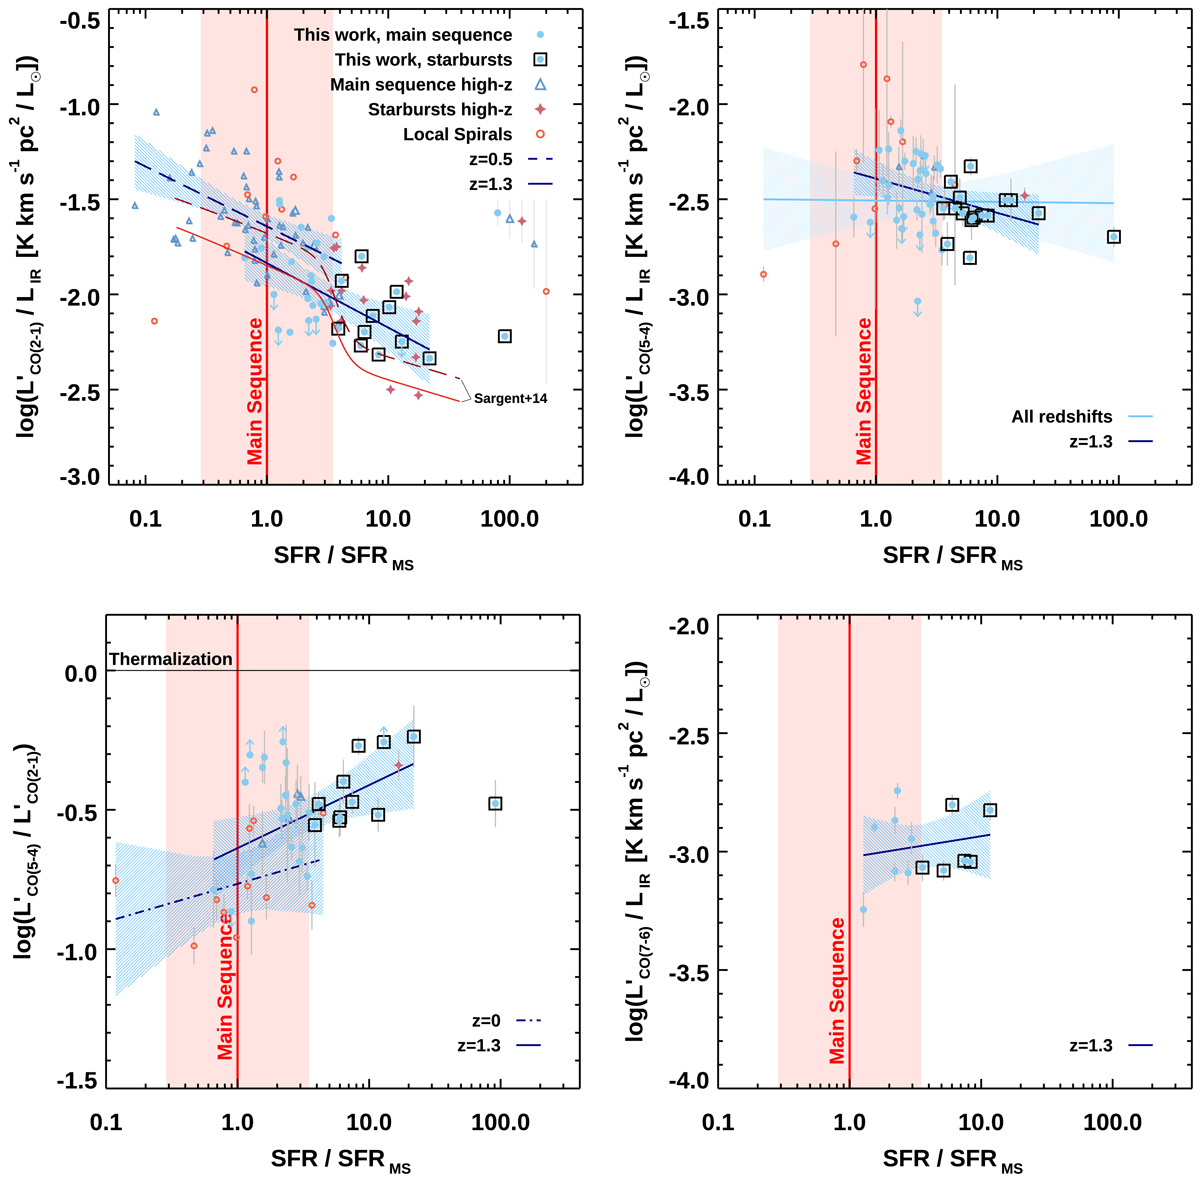
Fig. 6.
CO emission on and above the main sequence. L′ [K km s−1 pc2]/LIR [L⊙] for CO (2 − 1) (top left), CO (5 − 4) (top right), CO (7 − 6) (bottom right), and the ![]() /
/![]() ratio (bottom left) as a function of the distance from the main sequence. In every panel, the sample of main-sequence galaxies and starbursts at z ∼ 1.3 presented here is marked by blue filled circles and open black squares. Open blue triangles and purple stars indicate other distant MS galaxies and SBs (at z = 0.5−0.8 from the PHIBSS-2 survey of CO (2 − 1), Freundlich et al. 2019; at z ∼ 1.5 from D15, Silverman et al. 2018a,b). Open red circles signpost local spirals (Leroy et al. 2008; Kennicutt et al. 2011; Dale et al. 2012, 2017, Liu et al., in prep.). The red solid line and the shaded area indicate the main sequence within ∥ΔMS∥< 3.5 as parameterized by Sargent et al. (2014). The tracks and the shaded areas mark the best-fit models from the linear regression analysis and their 95% confidence interval when modeling the following samples: solid dark blue line: our galaxies at z ∼ 1.3, excluding the strongest outlier above the main sequence; dashed dark blue line: PHIBSS-2 galaxies at z = 0.5−0.8; dotted-dashed dark blue line: local spirals; solid light blue line: all samples available (see Table 3 for the parameters). The dashed and solid red lines in the top left panel show the tracks for the two-mode star formation model by Sargent et al. (2014) at z = 0.5 and 1.5 and for M⋆ = 1010.7 M⊙, the median mass of both the PHIBSS-2 and our sample. The median error bars for each sample are displayed in the panel.
ratio (bottom left) as a function of the distance from the main sequence. In every panel, the sample of main-sequence galaxies and starbursts at z ∼ 1.3 presented here is marked by blue filled circles and open black squares. Open blue triangles and purple stars indicate other distant MS galaxies and SBs (at z = 0.5−0.8 from the PHIBSS-2 survey of CO (2 − 1), Freundlich et al. 2019; at z ∼ 1.5 from D15, Silverman et al. 2018a,b). Open red circles signpost local spirals (Leroy et al. 2008; Kennicutt et al. 2011; Dale et al. 2012, 2017, Liu et al., in prep.). The red solid line and the shaded area indicate the main sequence within ∥ΔMS∥< 3.5 as parameterized by Sargent et al. (2014). The tracks and the shaded areas mark the best-fit models from the linear regression analysis and their 95% confidence interval when modeling the following samples: solid dark blue line: our galaxies at z ∼ 1.3, excluding the strongest outlier above the main sequence; dashed dark blue line: PHIBSS-2 galaxies at z = 0.5−0.8; dotted-dashed dark blue line: local spirals; solid light blue line: all samples available (see Table 3 for the parameters). The dashed and solid red lines in the top left panel show the tracks for the two-mode star formation model by Sargent et al. (2014) at z = 0.5 and 1.5 and for M⋆ = 1010.7 M⊙, the median mass of both the PHIBSS-2 and our sample. The median error bars for each sample are displayed in the panel.
Current usage metrics show cumulative count of Article Views (full-text article views including HTML views, PDF and ePub downloads, according to the available data) and Abstracts Views on Vision4Press platform.
Data correspond to usage on the plateform after 2015. The current usage metrics is available 48-96 hours after online publication and is updated daily on week days.
Initial download of the metrics may take a while.