Fig. 5.
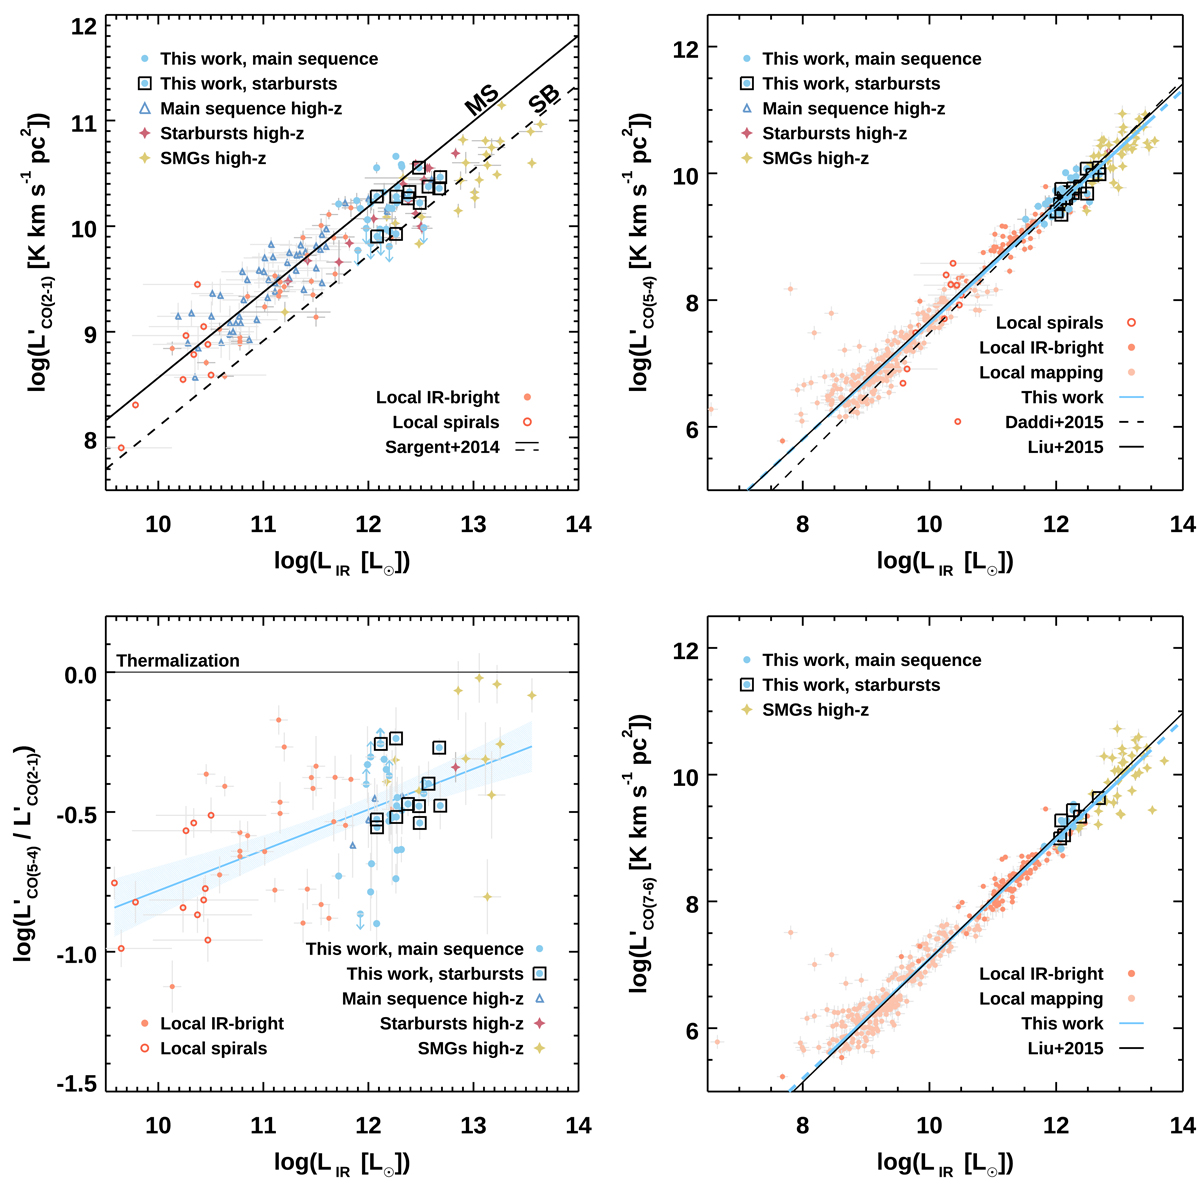
CO – IR luminosities relations. From the top left, clockwise: L′ [K km s−1 pc2] luminosities of CO (2 − 1), CO (5 − 4), CO (7 − 6), and the CO (5 − 4)/CO (2 − 1) ratio as a function of the IR luminosity LIR [L⊙]. Symbols are color-coded as labeled (see Sect. 3.6 for references), where our samples of main-sequence galaxies and starbursts (ΔMS ≥ 3.5) at z ∼ 1.3 are marked by blue filled circles and open black squares, respectively. The solid and dashed black lines show the best-fit linear models from previous works (Sargent et al. 2014; Liu et al. 2015a, D15). The blue lines mark our best model, where the dashed segments indicate its extrapolation. The blue shaded area in the bottom left figure shows the 95% confidence interval, omitted in the remaining panels for clarity. The best-fit parameters and the scatter are reported in Table 3. We adopted an extended LIR range in the right panels to show the ![]() and
and ![]() luminosities obtained from mapping nearby objects (Liu et al. 2015a), for which CO (2 − 1) observations on the same scales are not available. Note that the axes are inverted with respect to the canonical representation of star formation laws.
luminosities obtained from mapping nearby objects (Liu et al. 2015a), for which CO (2 − 1) observations on the same scales are not available. Note that the axes are inverted with respect to the canonical representation of star formation laws.
Current usage metrics show cumulative count of Article Views (full-text article views including HTML views, PDF and ePub downloads, according to the available data) and Abstracts Views on Vision4Press platform.
Data correspond to usage on the plateform after 2015. The current usage metrics is available 48-96 hours after online publication and is updated daily on week days.
Initial download of the metrics may take a while.