Fig. 4.
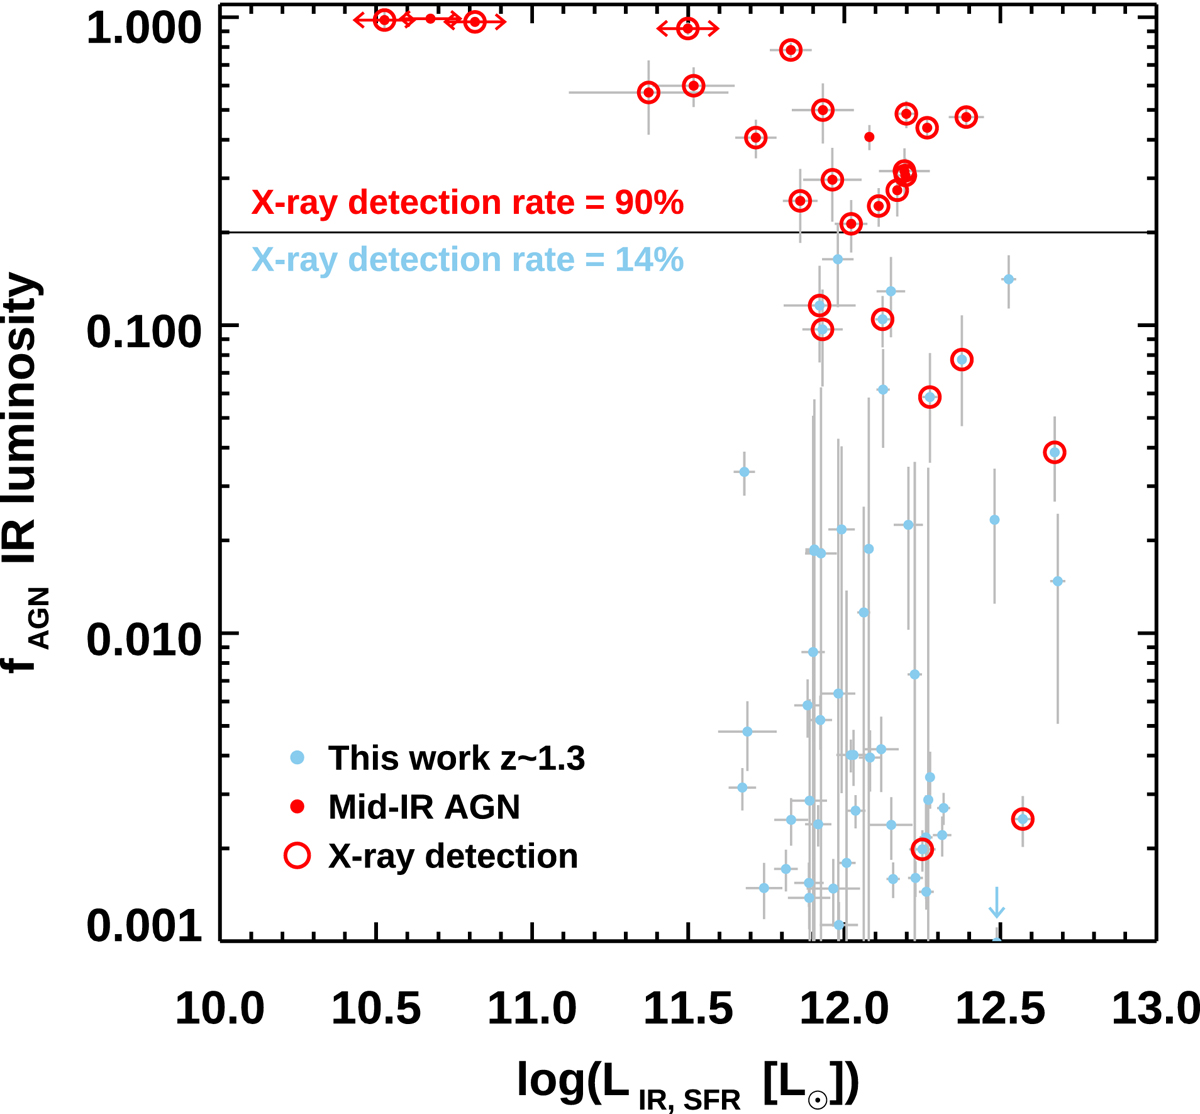
AGN contamination. Fraction of the AGN contribution to the total IR luminosity (fAGN = LIR, AGN/LIR) as a function of the IR luminosity from the star-forming component of the SED fitting (LIR, SFR). The blue points show the objects with a line emission or an upper limit (Flag ≥ 0) and a good model of the SED. Red solid circles indicate mid-IR selected AGN. Red empty circles indicate Chandra 2–10 keV detections with L2−10 keV ≥ 1042 erg s−1. Horizontal red arrows indicate sources with unreliable estimates of LIR, SFR due to the strong AGN contamination.
Current usage metrics show cumulative count of Article Views (full-text article views including HTML views, PDF and ePub downloads, according to the available data) and Abstracts Views on Vision4Press platform.
Data correspond to usage on the plateform after 2015. The current usage metrics is available 48-96 hours after online publication and is updated daily on week days.
Initial download of the metrics may take a while.