Fig. 2.
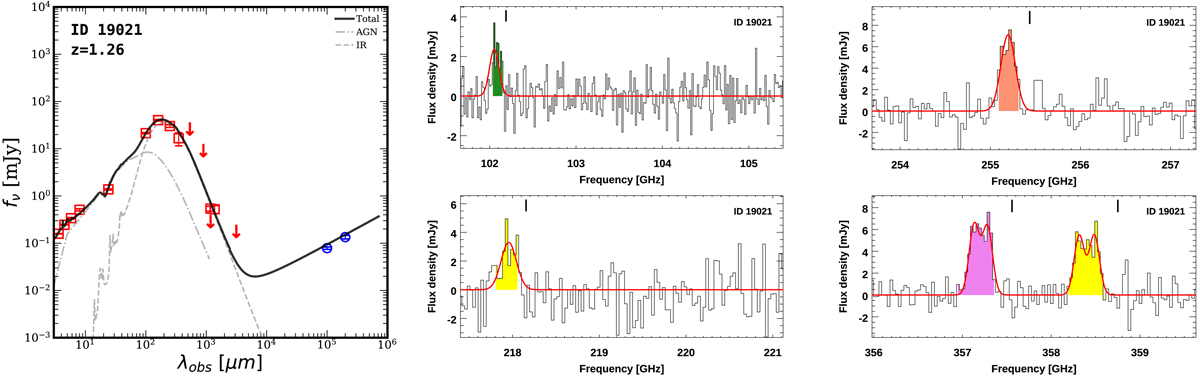
Example of ALMA spectra and far-IR spectral energy distribution. Left: red open squares and arrows indicate detections and 3σ upper limits on the IR photometry that we modeled. Blue open circles indicate radio measurements, which we did not include in the fitting. The gray dashed and dotted-dashed lines mark the best-fit Draine & Li (2007) and Mullaney et al. (2011) templates for the star-forming and AGN components, respectively. A stellar template was included when modeling the IRAC bands, but we do not show it to avoid confusion. The black solid line indicates the sum of all the templates. Right: ALMA spectra with detected CO (2 − 1) (green), CO (5 − 4) (orange), CO (7 − 6) (purple), and [C I] (yellow) transitions (CO (4 − 3) is not available for this source). The solid red line indicates the best-fit Gaussian model. The black tick shows the expected line position based on the optical redshift zspec, opt. The full compilation of SEDs and spectra from which we extracted reliable line measurements (Sect. 3.2.2) is available at http://doi.org/10.5281/zenodo.3967380.
Current usage metrics show cumulative count of Article Views (full-text article views including HTML views, PDF and ePub downloads, according to the available data) and Abstracts Views on Vision4Press platform.
Data correspond to usage on the plateform after 2015. The current usage metrics is available 48-96 hours after online publication and is updated daily on week days.
Initial download of the metrics may take a while.