Fig. 1.
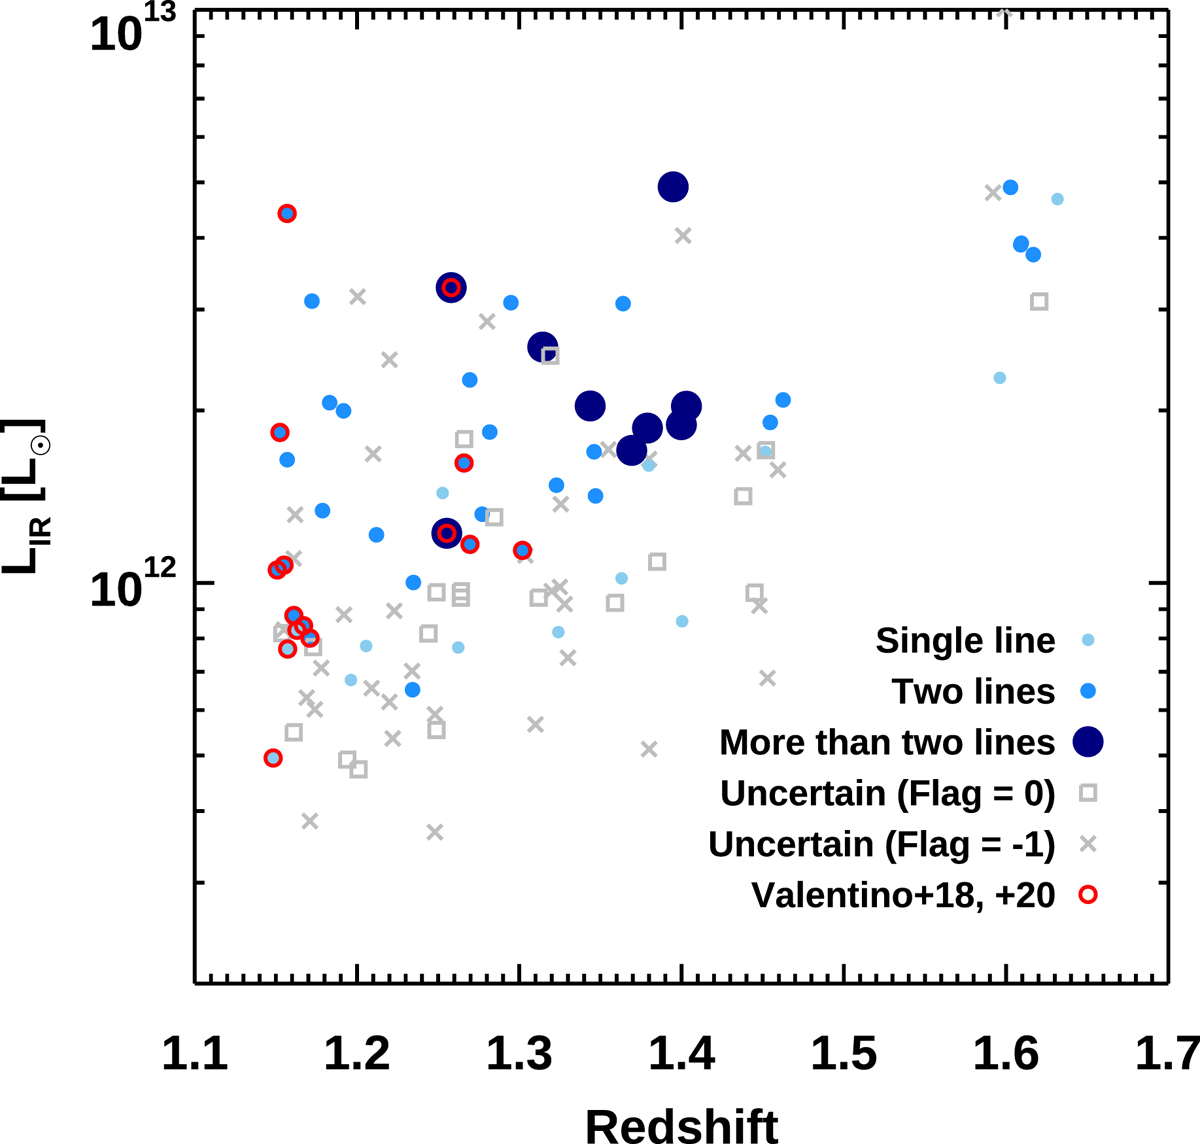
Survey design: the redshifts and total IR luminosities distributions of the primary CO (5 − 4) sample of our campaign. Gray crosses mark uncertain sources due to poor optical redshifts (Flag = −1). Gray open squares indicate uncertain upper limits on every covered line with trustable zspec, opt (Flag = 0). Light blue, blue, and navy blue filled circles indicate reliable sources with usable information about one, two, or more than two transitions from this work (Flag ≥ 0.5). Red open circles mark the objects already presented in V18 and V20. Galaxies without an updated far-IR modeling based on the photometry in Jin et al. (2018) are not shown. The flagging classification and the definition of reliable and uncertain data are described in Sect. 3.2.2.
Current usage metrics show cumulative count of Article Views (full-text article views including HTML views, PDF and ePub downloads, according to the available data) and Abstracts Views on Vision4Press platform.
Data correspond to usage on the plateform after 2015. The current usage metrics is available 48-96 hours after online publication and is updated daily on week days.
Initial download of the metrics may take a while.