Fig. 14
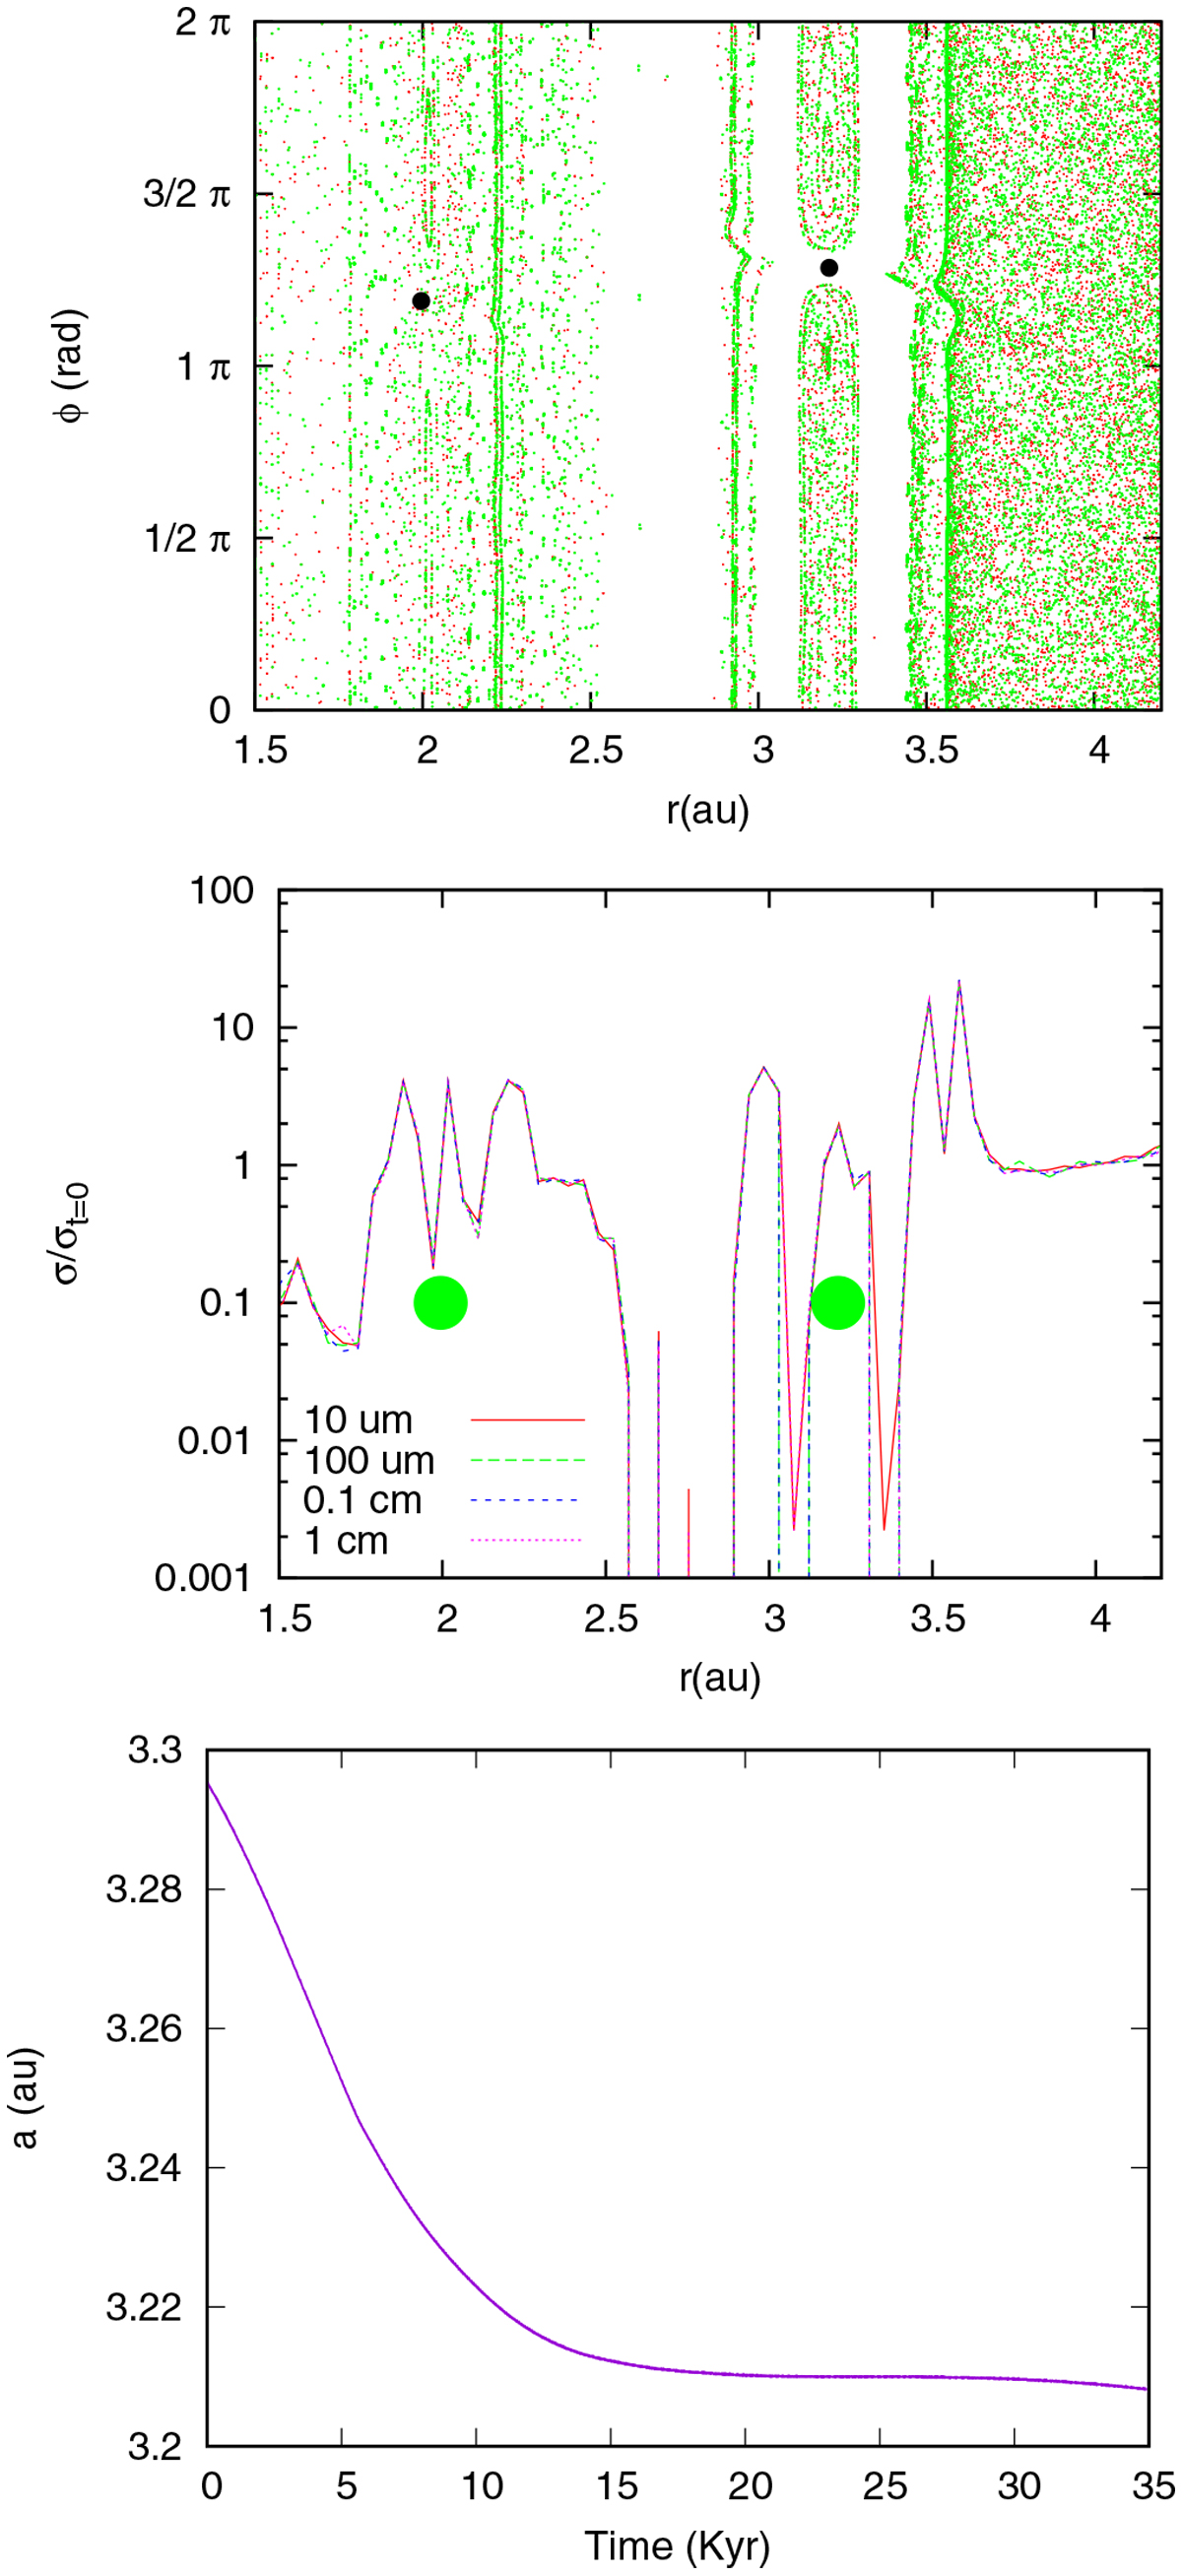
Top panel: dust distribution around planets locked in 2:1 resonance at t = 40 Kyr in a Model 1 with Σ0 = 50 g cm−2. The black circles give the planets’ positions. Middle panel: histogram of the dust surface density where the planets’ orbital radius is given by a green filled circle. Bottom panel: semi-major axis evolution with time of the outer planet showing a period of stalled migration when the pair of planets are trapped in resonance.
Current usage metrics show cumulative count of Article Views (full-text article views including HTML views, PDF and ePub downloads, according to the available data) and Abstracts Views on Vision4Press platform.
Data correspond to usage on the plateform after 2015. The current usage metrics is available 48-96 hours after online publication and is updated daily on week days.
Initial download of the metrics may take a while.