Fig. 13
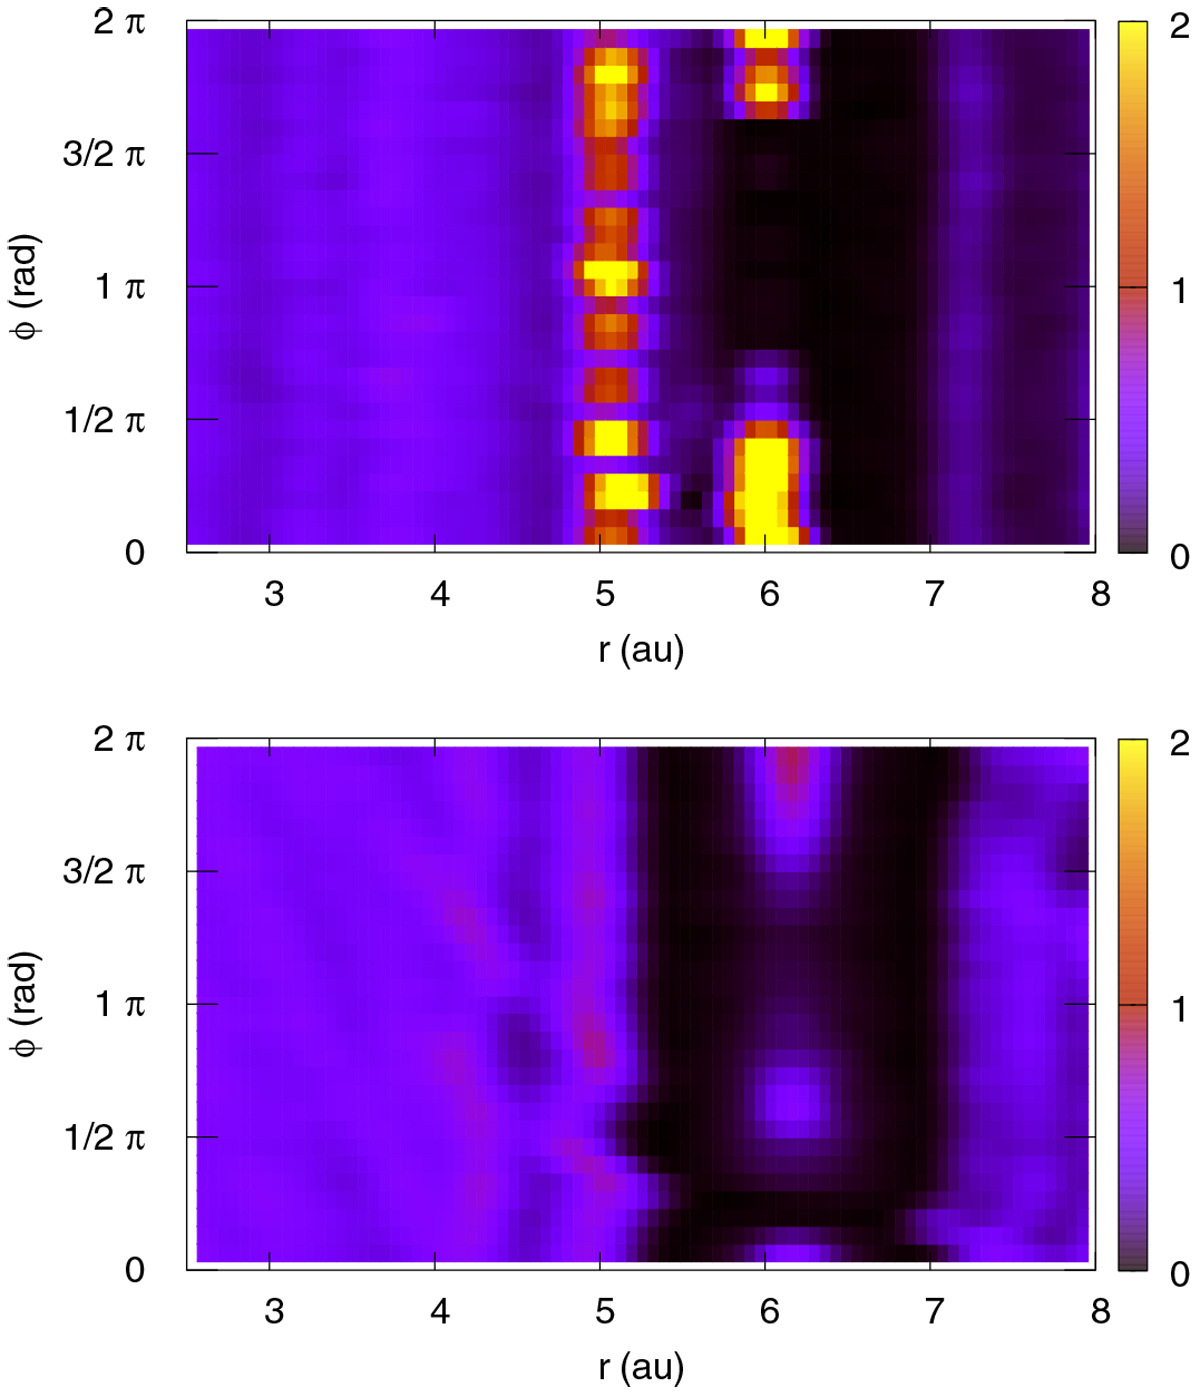
Smoothed maps of the dust distribution in the proximity of the planets. The top panel shows the density distribution, normalized to the total number of dust particles in the model, around two planets in 2:1 resonance (Figs. 10 and 11). The color bar range is in units of 10−3 ; the azimuthal resolution is 0.2 rad while the radial resolution is 0.15 au. The bottom panel illustrates the dust distribution for a single planet with mass m = 200 M⊕. As smoothing function, we applied a simple bell-shaped function (Lucy 1977).
Current usage metrics show cumulative count of Article Views (full-text article views including HTML views, PDF and ePub downloads, according to the available data) and Abstracts Views on Vision4Press platform.
Data correspond to usage on the plateform after 2015. The current usage metrics is available 48-96 hours after online publication and is updated daily on week days.
Initial download of the metrics may take a while.