Fig. 11
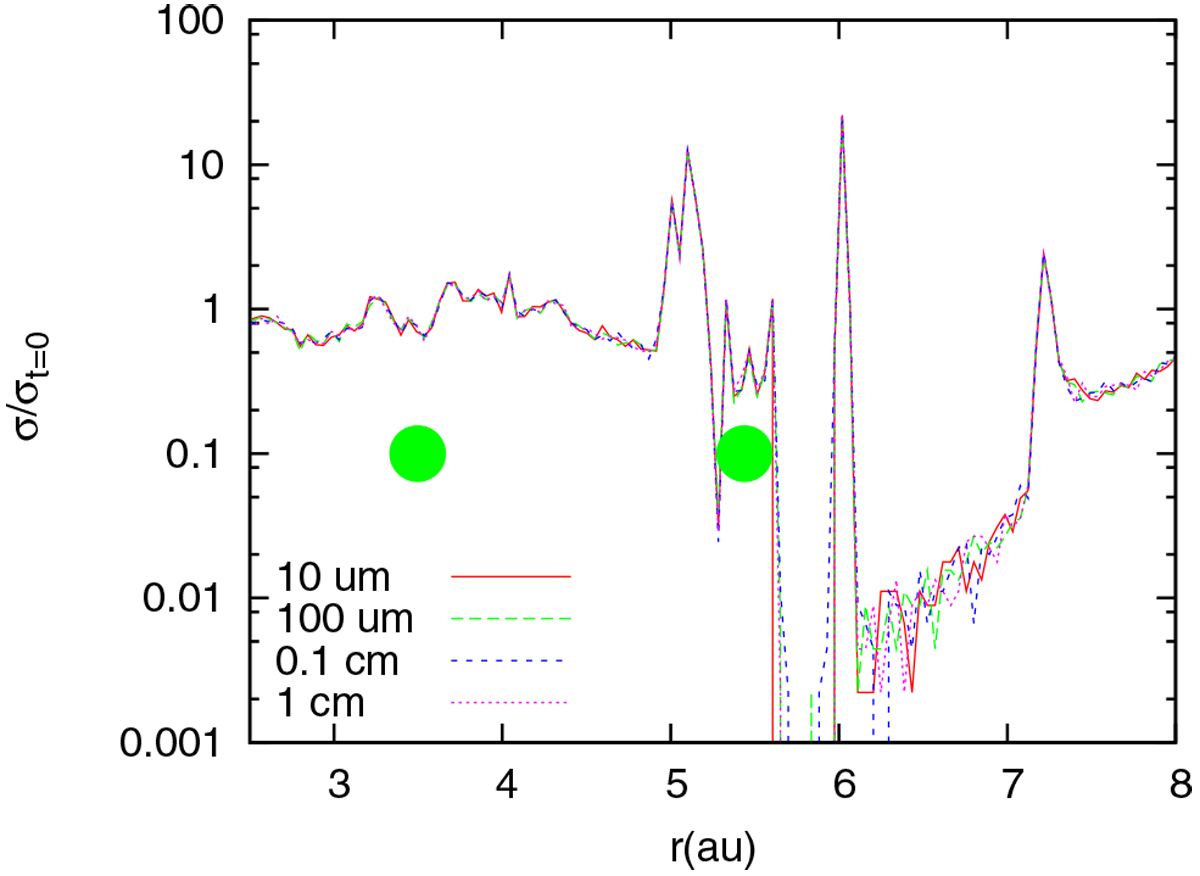
Histogram of the dust surface density, normalized to that at t = 0, around a pair of planets trapped in 2:1 resonance The plot refers to the same case as in Fig. 10, at time t = 70 Kyr (see bottom panel of that figure). The green filled circles give the positions of the planets. The different line colors correspond to different grain sizes, from 10 μm to 1 cm. Only minor differences are observed among the various sizes because all grains are well coupled to the gas.
Current usage metrics show cumulative count of Article Views (full-text article views including HTML views, PDF and ePub downloads, according to the available data) and Abstracts Views on Vision4Press platform.
Data correspond to usage on the plateform after 2015. The current usage metrics is available 48-96 hours after online publication and is updated daily on week days.
Initial download of the metrics may take a while.